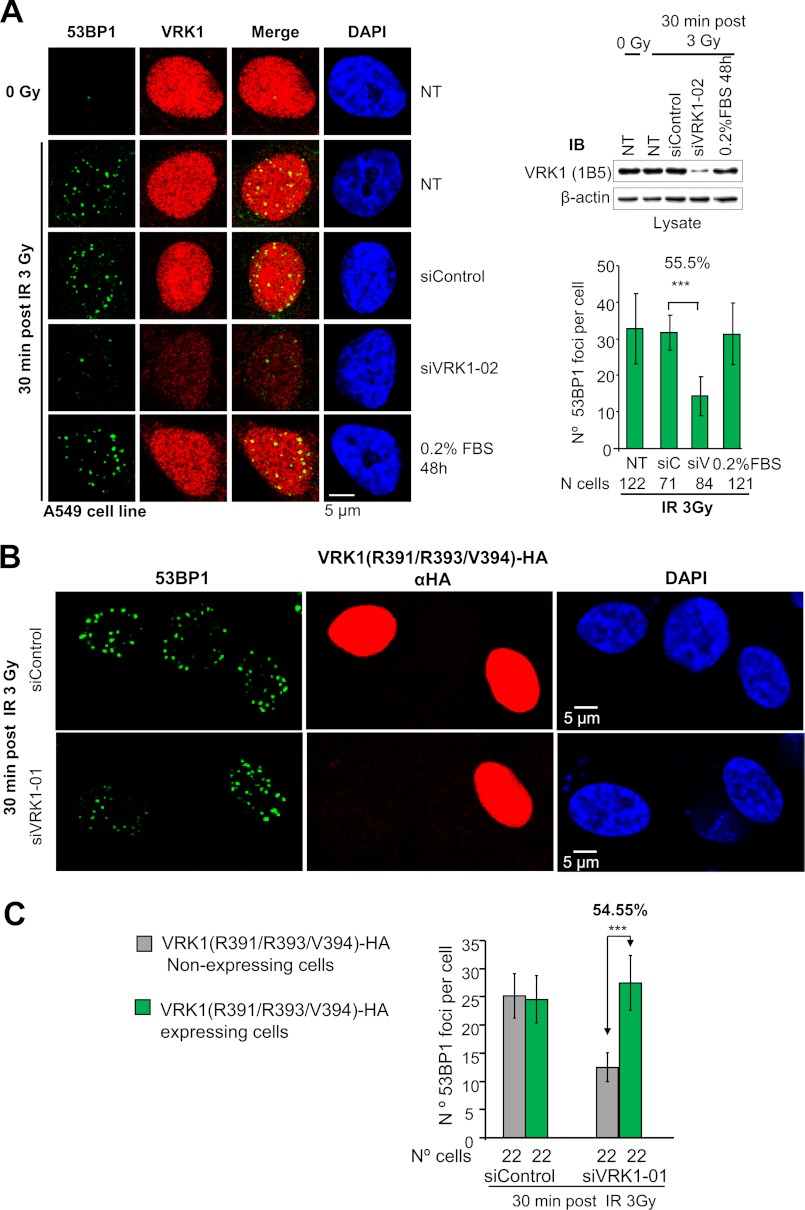
FIGURE 3.
Knockdown of VRK1 prevents 53BP1 ionizing radiation-induced focus formation. A, A549 cells were transfected with siRNA oligos targeting VRK1 (siVRK1-02), control oligos (siControl), not transfected (NT), or not transfected and serum-starved (0.2% FBS). Forty-eight hours after transfection, cells were either untreated or treated with 3 Gy. 53BP1 focus formation was determined 30 min after irradiation by confocal microscopy (9). VRK1 was detected with a polyclonal antibody, and 53BP1 was detected with a monoclonal antibody. VRK1 knockdown efficiency was checked by Western blot (top right) (18, 23). Quantification of the number of 53BP1 foci per cell was performed with ImageJ software. Around 100 cells for each condition were analyzed. Means, S.D., and number of cells analyzed are shown in the graph (bottom right). A representative field with several cells to show the phenotype and the cell cycle profile of these cells are shown in supplemental Fig. S2A. A different siRNA induced the same phenotype (supplemental Fig. S2B). ***, p < 0.001. NT, non-transfected control; siC, siControl; siV, siVRK1-02. B, rescue of defective 53BP1 focus formation by an siRNA-resistant VRK1. A549 cells were transfected with siVRK1-01 to knock down endogenous VRK1 or with siControl. After 36 h, cells were retransfected with 2 μg of plasmid HA-VRK1(R391/R393/V394) with three silent substitutions that render the cDNA insensitive to si-VRK1-01. Thirty-six hours after retransfection, cells were irradiated with 3 Gy and left to recover for 30 min. Cells were immunostained with anti-HA monoclonal antibody to identify cells expressing exogenous VRK1. 53BP1 foci were visualized by staining with 53BP1 polyclonal antibody. The efficiency of endogenous VRK1 silencing and expression of siRNA-resistant VRK1 was determined by Western blot (supplemental Fig. S5). C, quantification of the number of 53BP1 foci in the rescue experiment. NIH ImageJ software was used for counting 53BP1 foci. Means of the number of 53BP1 foci per cell and S.D. are represented in the graph. The number of analyzed cells is indicated below. ***, p < 0.001. siV1-1, siVRK1-01; IB, immunoblot. Error bars represent the standard deviation.

