FIGURE 3.
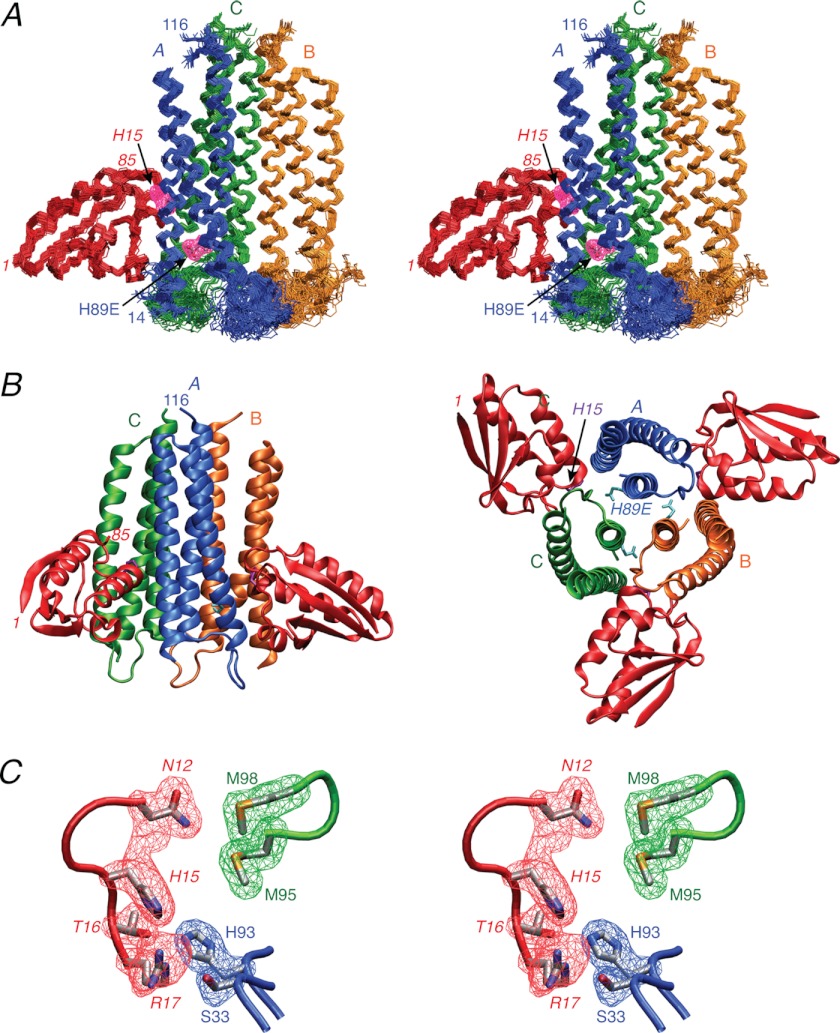
Solution structure of the IIAChb*(H89E)-HPr complex. A, stereoview of a superposition of the backbone (N, Cα, and C) atoms of the final 100 simulated annealing structures with the A, B, and C subunits of the IIAChb*(H89E) symmetric trimer in blue, gold, and green, respectively, and HPr in red. HPr is shown interacting with the A and C subunits of IIBChb*. The purple meshes represent the atomic density probability maps (66) for the two active site residues, H89E of subunit A of IIAChb*(H89E) and His-15 of HPr. (The probability maps are drawn at a value of 20% maximum.) Note that because IIAChb*(H89E) is a symmetric trimer there are three identical binding sites formed at the interfaces between the A and C subunits, the C and B subunits, and the B and A subunits. B, ribbon diagrams of the complex showing two HPr molecules bound to the IIAChb*(H89E) trimer (left panel) and an orthogonal view depicting three molecules of HPr bound to the IIAChb*(H89E) trimer (right panel). The color coding is the same as in A. C, stereoview showing a reweighted atomic probability density map (drawn at a value of 20% maximum and calculated from the final 100 simulated annealing structures) for some of the interfacial side chains displayed as blue and green meshes for the A and C subunits for IIAChb*(H89E) and as a red mesh for HPr. The backbones are shown as tubes color coded as in A; the side chains of the restrained regularized mean structure are color coded according to atom type (carbon, gray; oxygen, red; nitrogen, blue; sulfur, yellow). Residues of HPr are labeled in italics.

