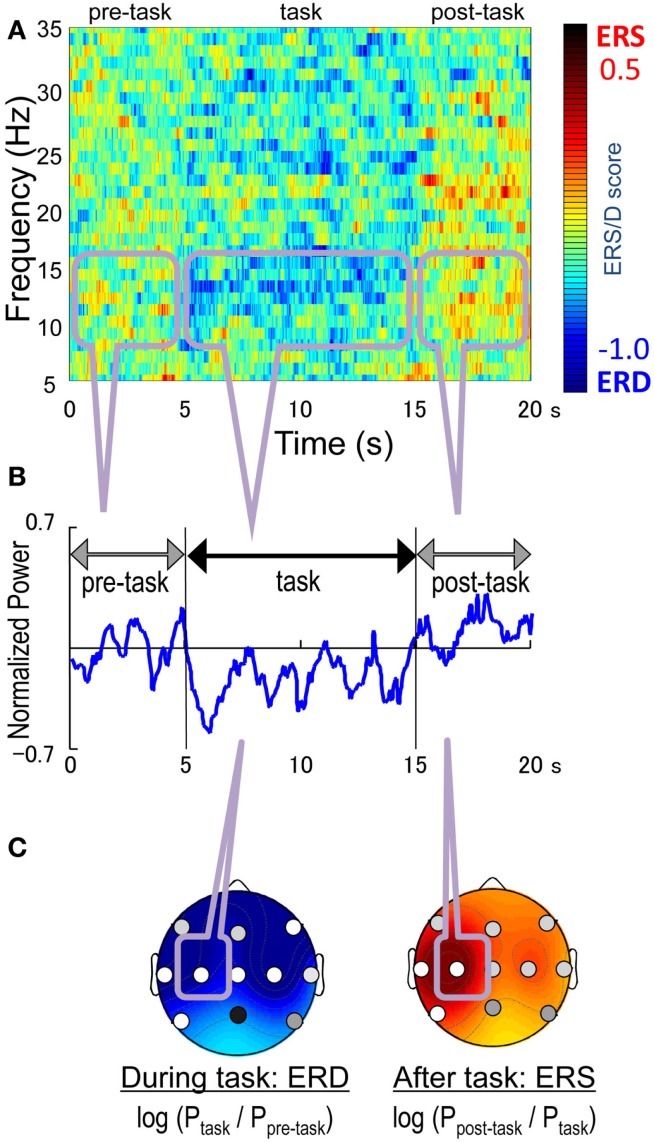
Figure 1.
The peak and average frequency analysis during right finger-tapping. (A) the normalized power spectrum obtained by a fast Fourier transform (FFT) at C3, (B) an example of the averaged power of the EEG oscillation at C3 (C) ERD/ERS patterns. The peak frequency was the frequency with the strongest power in 8–16 Hz.

