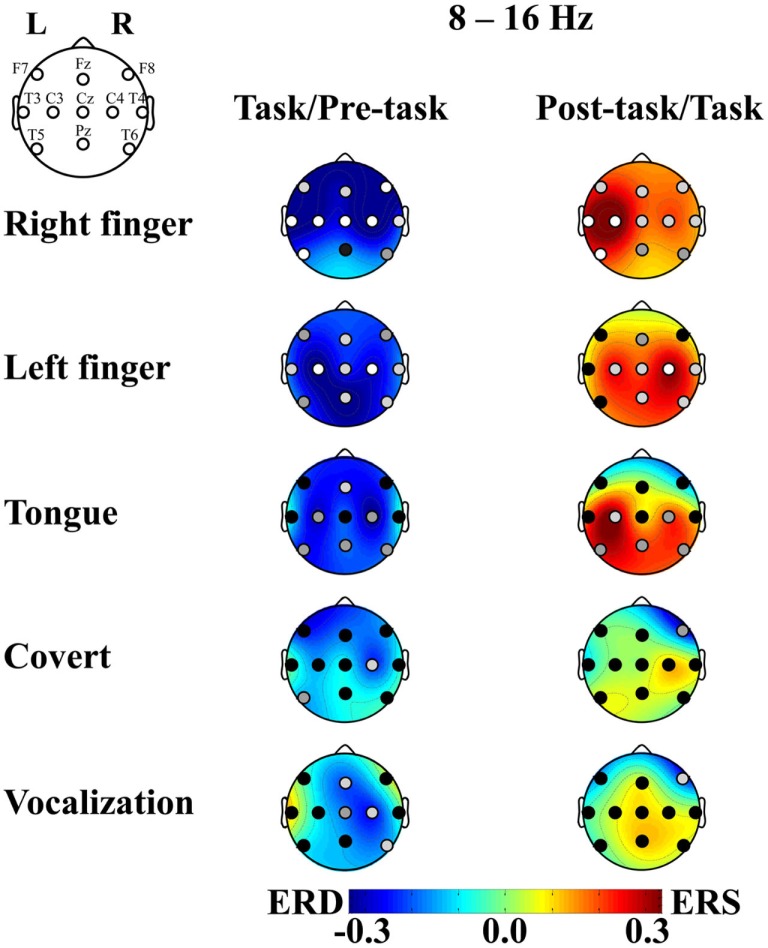
Figure 2.
ERD/S and p-value of the t-statistics plotted in relation to the movement tasks. The mean across subjects is shown for (1) right finger-tapping, (2) left finger-tapping, (3) tongue exercise, (4) articulation without vocalization (abbreviated to “covert”), and (5) vocalization, from the top to the bottom. ERD is shown in cool colors while ERS is shown in warm colors. The p-value at each recording site is shown in the gray level of the filled circle: white, light gray, gray, and black indicate p < 0.001, p < 0.05, p < 0.1, and p > 0.1, respectively. The left column compares between the pre-task and the task intervals. The right column compares between the task and post-task intervals.

