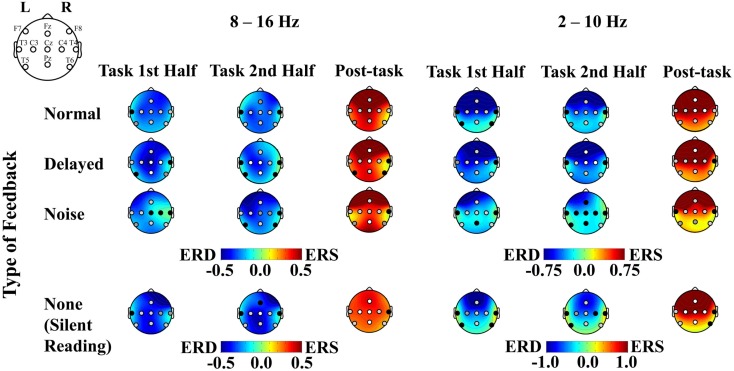
Figure 5.
Plots of ERD, ERS, and p values associated with the listening and the silent reading tasks. ERD and ERS are shown in cool and warm colors, respectively. The left figure compares between the pre-task and the first task intervals, the middle figure compares between the pre-task and the second task intervals, and the right figure compares between the second activation and the post-task intervals. The p-value for each recording site is shown in white, light gray, gray, and black for p < 0.001, p < 0.05, p < 0.1, and p > 0.1, respectively. The results for the 8–16 and 2–10 Hz range are shown on the left and right sides, respectively.

