
Fig. 2.
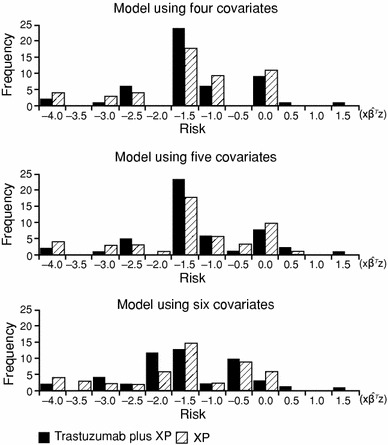
Distribution of estimated values by linear predictor. XP capecitabine plus cisplatin. The ordinate is the number of patients and the abscissa is the risk score (estimated hazard number for each patient). The risk of mortality increases as the plot moves to the right