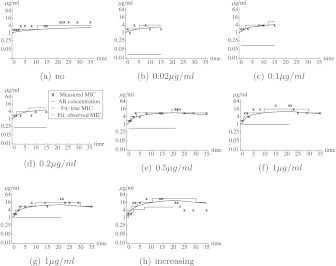
Fig. 1.
Observed MIC values in the tetracyclin lab experiments and the best model fit. Each figure corresponds to a different experiment. In (a), the E. coli were grown in absence of antibiotics. In (b)–(d), the E. coli grew in the presence of a constant concentration of tetracyclin from day 0 to day 15. In (e)–(g), the E. coli grew in the presence of a constant concentration of tetracyclin from day 0 to day 21. Afterward, the E. coli grew in absence of tetracyclin. In (h), the concentration of tetracyclin was stepwise increased. The black crosses correspond to the data from the experiments. The blue curve corresponds to the fit, the dashed blue step function correspond to the MIC-value that would have been observed if there would be no measurement error. The red lines correspond to the concentration of tetracycline to which the E. coli cells are exposed (Color figure online)

