Fig. 2.
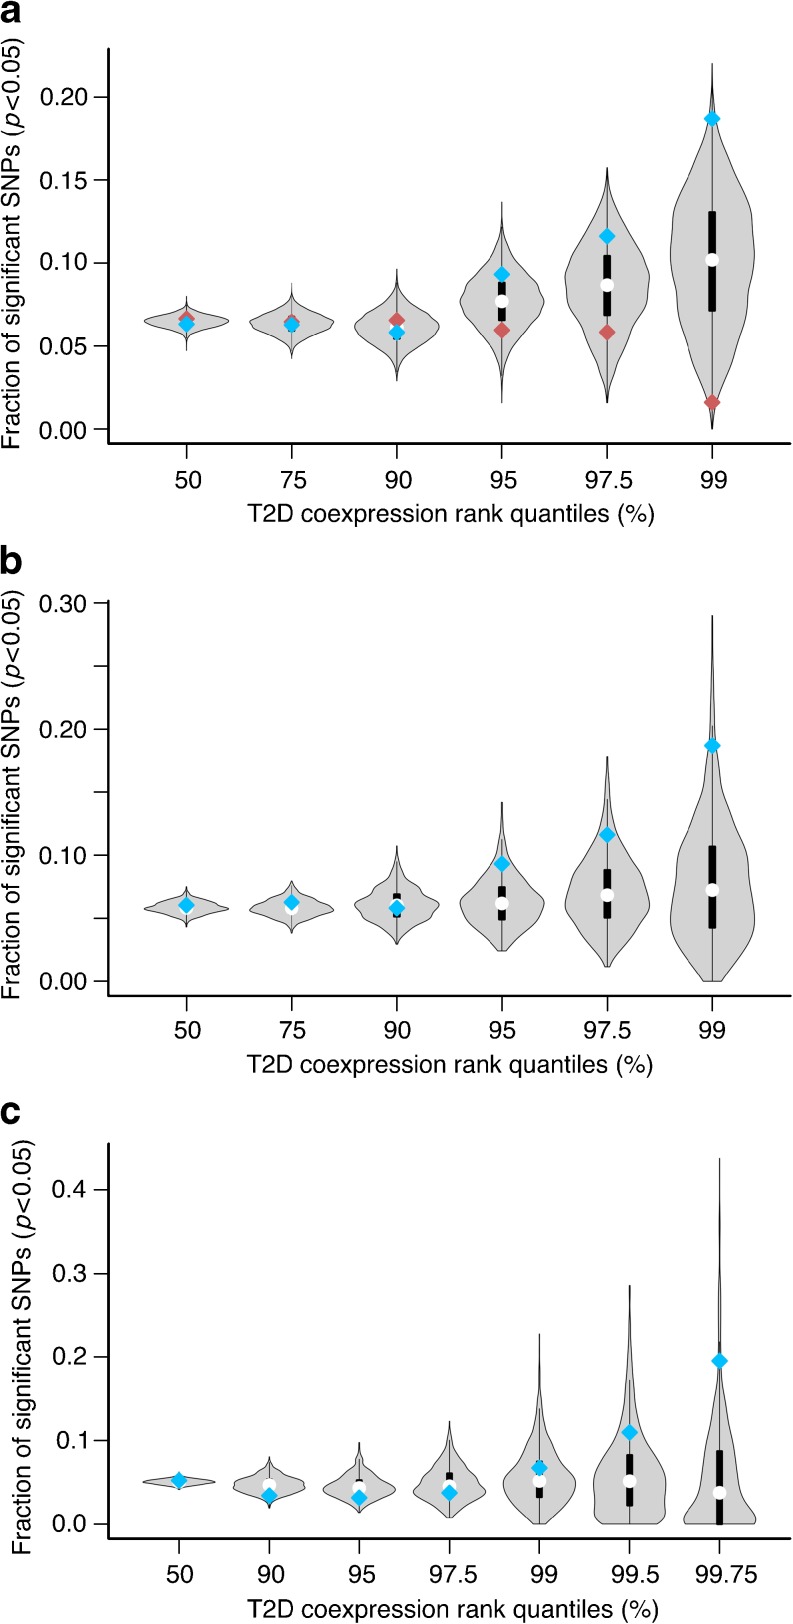
(a) Enrichment of p T2D < 0.05 at increasing type 2 diabetes coexpression score quantiles. The genes in each quantile were ordered by decreasing Δrank, then split at the median Δrank. The genes in each half quantile were connected to eSNPs using eQTL datasets mapped in liver, omental and subcutaneous adipose tissue. The blue and red points represent, respectively, the p T2D < 0.05 for the top and bottom halves. To estimate the null distribution, we randomly selected half of the genes in each group 10,000 times and observed the p T2D < 0.05 for each sample. The violin plots represent the distribution of the permutations for each set of genes. The separation between the top and bottom halves as the threshold is increased suggests that the coexpression rank, coupled with the Δrank, is a useful metric for selecting genes relevant to the disease process. p = 0.12 for 97.5 percentile; p = 0.007 for 99 percentile. (b) Estimation of the null distribution by permuting the initial expression traits. As another estimate of the null distribution, we randomly selected 33 genes as the initial expression traits. As in (a), we then observed the p T2D < 0.05 in WTCCC data for the top half of genes at each cut-off for each sample. The violin plots represent the distribution of this value at each cut-off for each sample. We repeated this permutation analysis 1,000 times. p = 0.066 for 97.5 percentile; p = 0.026 for 99 percentile. (c) Validation of results using an independent dataset. To validate our findings shown in (b), we repeated the permutation analysis using data obtained from the GENEVA diabetes study. p = 0.13 for 99.5 percentile; p = 0.042 for 99.75 percentile. Blue diamond, p T2D < 0.05 for genes with change in rank greater than quantile median; red diamond, p T2D < 0.05 for genes with change in rank less than quantile median. T2D, type 2 diabetes

