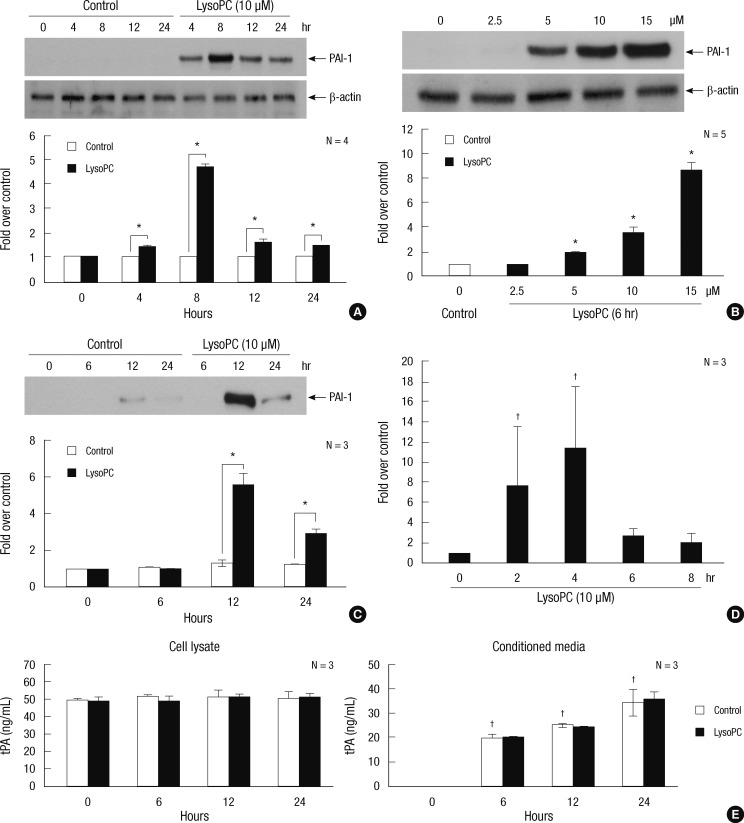
Fig. 1.
The effects of lysoPC on PAI-1 expression in VSMCs. (A), (B) and (C) Induction of PAI-1 protein as detected by Western blot analysis. Representative blots are shown in the upper section of each panel. The intensity of the bands was densitometrically determined and normalized to that of corresponding β-actin bands. Graphic data are depicted in the lower part of the panel. (A) Time-course effects of 10 µM lysoPC in the cell lysate. (B) Dose-response effects of lysoPC at 6 hr of treatment in the cell lysate. (C) Time-course effects of 10 µM lysoPC in the conditioned media normalized to the cell protein content. (D) Time-course effects of 10 µM lysoPC on gene expression of PAI-1 as evaluated by real-time RT-PCR. (E) Time-course effects of 10 µM lysoPC on tPA in the cell lysate and conditioned media as assessed by ELISA. *P < 0.05 vs vehicle-treated control; †P < 0.05 vs baseline.

