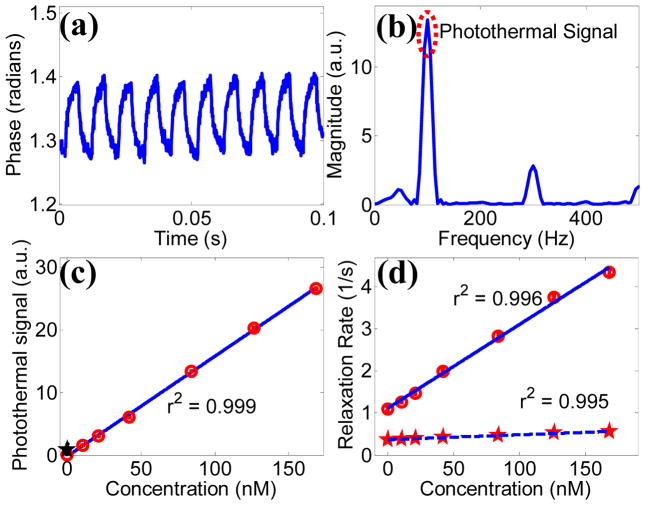
Fig. 2.
(Color online) (a) Example temporal phase data acquired from the base of 84 nM CNT phantom during photothermal modulation. (b) Fourier transform of processed phase data. (c) Photothermal signal as a function CNT concentration. The black star indicates the photothermal signal of a scattering control (μs = 100 cm−1). (d) MRI relaxivity curves of carbon nanotubes for both T1 (dashed) and T2 contrast (solid).

