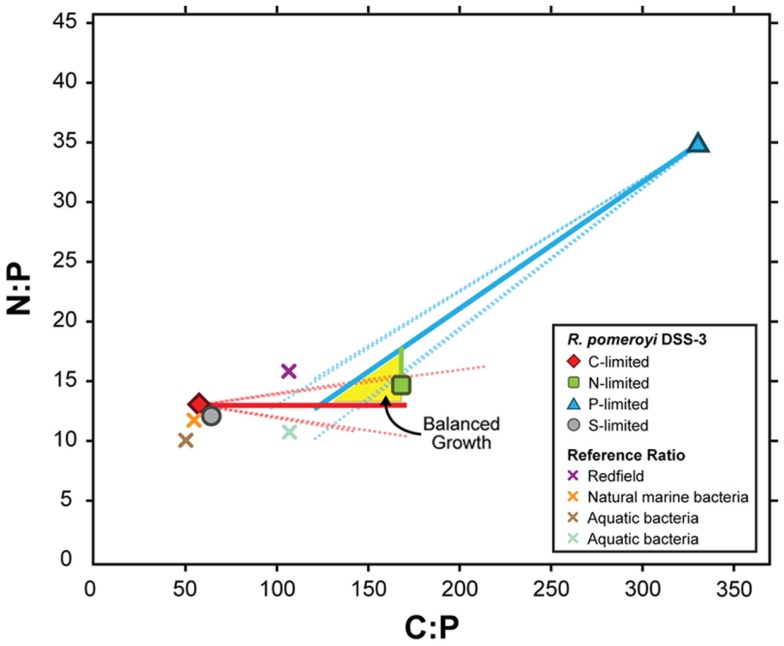
Figure 1.
Modeled C:P and N:P atomic ratios of R. pomeroyi DSS-3 cells over a range of depletion factors (α) for the limiting element (see Materials and Methods). The model assumes that limitation decreases the concentration of the limiting element relative to its value under balanced growth by a factor α, but the non-limiting elements are not affected. Measured C:N:P ratios in the element-limited chemostats are shown as symbols with bold borders, and modeled balanced growth ratios assuming different values of α are shown as solid lines. Dotted lines show elemental ratios if one of the non-limiting elements also changes during limitation, but by a factor 10-fold less than for the limiting element. The region where the three lines intersect (yellow shading) indicates the simultaneous solution for the C:N:P ratio (∼154:15:1). Other plotted C:P and N:P ratios are as follows: gray circle with black border, S-limited R. pomeroyi DSS-3 cells; purple X, Redfield ratio (Redfield, 1934); orange X, marine bacteria (Cotner et al., 1997); brown X, aquatic bacteria (Fagerbakke et al., 1996); blue X, freshwater bacteria (Cotner et al., 2010).

