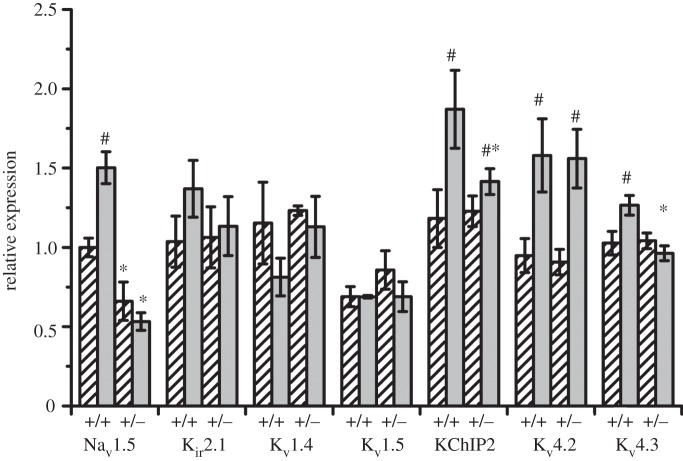
Figure 1.
mRNA expression patterns. Graph of mRNA expression in Na+ and K+ channels in the LV (bars with stripes) and RV (grey bars) of WT and Scn5a+/− hearts. Values are given relative to Nav1.5 mRNA expression in LV WT hearts. Significant differences: asterisks (*), effect of genotype; hashes (#), effect of cardiac ventricle (n = 4 for each group).

