
Figure 4.
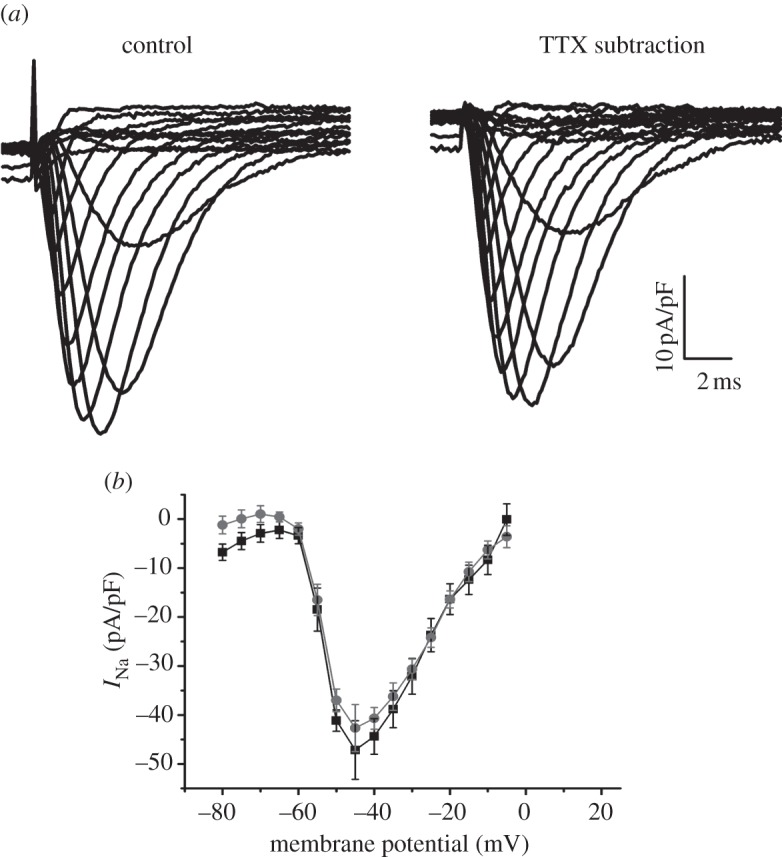
(a) Example trace of an INa current from a myocyte from the LV of a WT heart, before addition of 10 μM TTX, and then with TTX subtraction. (b) I–V curve for the two conditions (squares, control; circles, TTX substraction), with no significant differences (n = 4).