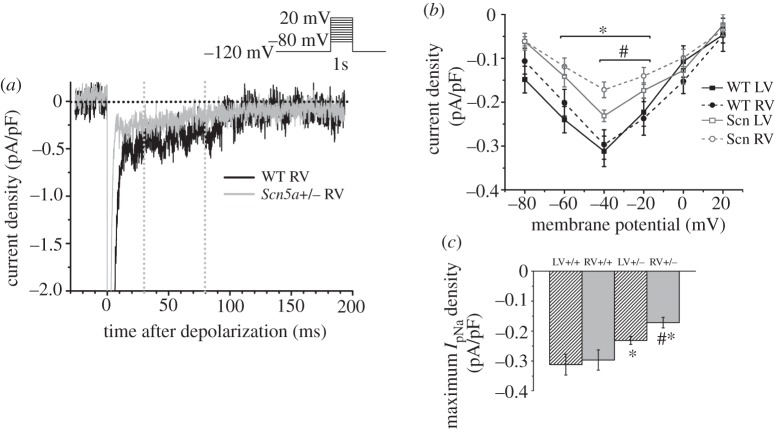
Figure 6.
IpNa measurements. (a) Example traces from a test pulse to −20 mV from the LV and RV of WT and Scn5a+/− myocytes. The vertical lines denote 30 and 80 ms after depolarization. (b) I–V relationship of mean IpNa from 30 to 80 ms after depolarization in myocytes from each group. (c) Bar graph of maximum IpNa density averaged from 30 to 80 ms after depolarization. Significant differences: asterisks (*), effect of genotype; hashes (#), effect of cardiac ventricle (n = 10 for each group).

