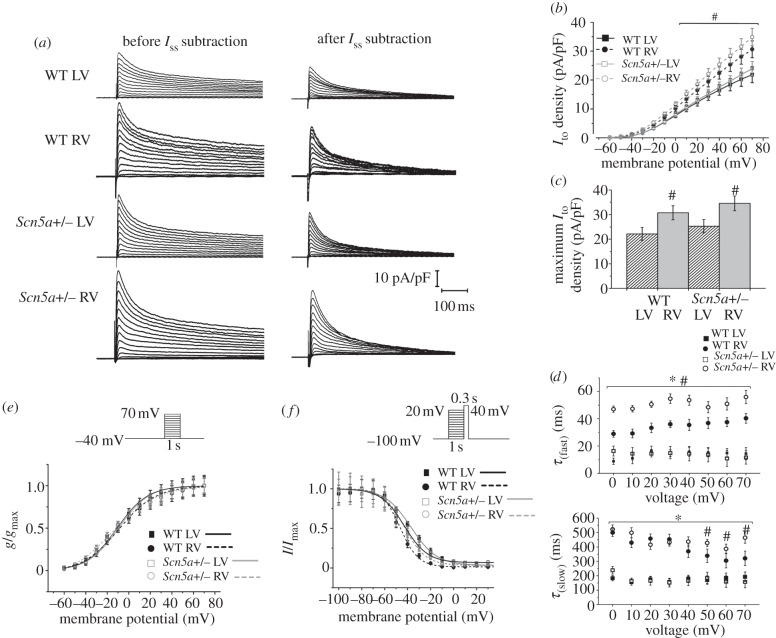
Figure 7.
Ito measurements. (a) Typical raw trace from the LV of a WT heart and example traces from the LV and RV of WT and Scn5a+/− hearts where the sustained current has been subtracted from the point of depolarization onwards, thus leaving the transient outward current. The traces have been normalized to cell capacitance, and the protocol is shown in the inset. (b) I–V relationship of myocytes from the LV and RV of WT and Scn5a+/− hearts. (c) Bar graph of maximum Ito density. (d) Kinetics of inactivation from myocytes from all groups, with the curve fitted to a double exponential decay function. Significant differences: asterisks (*), effect of genotype; hashes (#), effect of cardiac ventricle (n = 14 for each group). (e) Activation and (f) inactivation curves from myocytes from the LV and RV of WT and Scn5a+/− hearts, with Boltzmann fits (n = 14 for activation, n = 13 for inactivation for each group).

