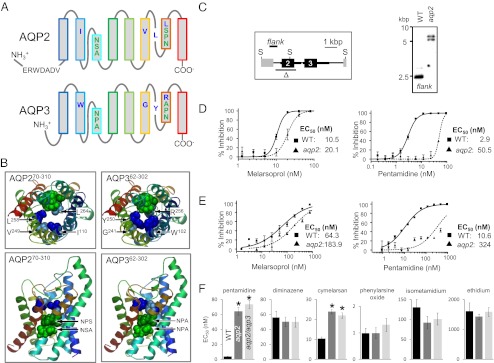
Fig. 1.
Cells lacking the unusual AQP2 are MPXR. (A) Schematic representation of AQP2 (Tb927.10.14170) and AQP3 (Tb927.10.14160). The selectivity filter residues are indicated; NSA/NPS/IVLL in AQP2 and NPA/NPA/WGYR in AQP3. An AQP2-specific insertion is also indicated. (B) Homology models for AQP2 and AQP3 showing the key amino acids that line the channel (colors as in A). The models were generated using SWISS-MODEL (51) and the Protein Data Bank coordinates 1ldfA. (C) Schematic map (Left) and Southern blot (Right) showing AQP2 gene knockout. Δ indicates the region deleted and “flank” indicates the 671-bp probe. Transcription is from left to right. Thicker black lines indicate the predicted untranslated regions. Genomic DNA was digested with SacII (S) before Southern blotting. (D) Bloodstream-form cells. Dose–response curves for melarsoprol and pentamidine. Wild-type (WT) cells are compared with aqp2 null cells. EC50 values are shown. (E) Insect-stage (procyclic form) cells. Other details as in D above. (F) Bloodstream-form cells. EC50 values for other related drugs. Average and SEM are shown (n ≥ 10). *P < 0.0001 as determined using a one-way ANOVA test.

