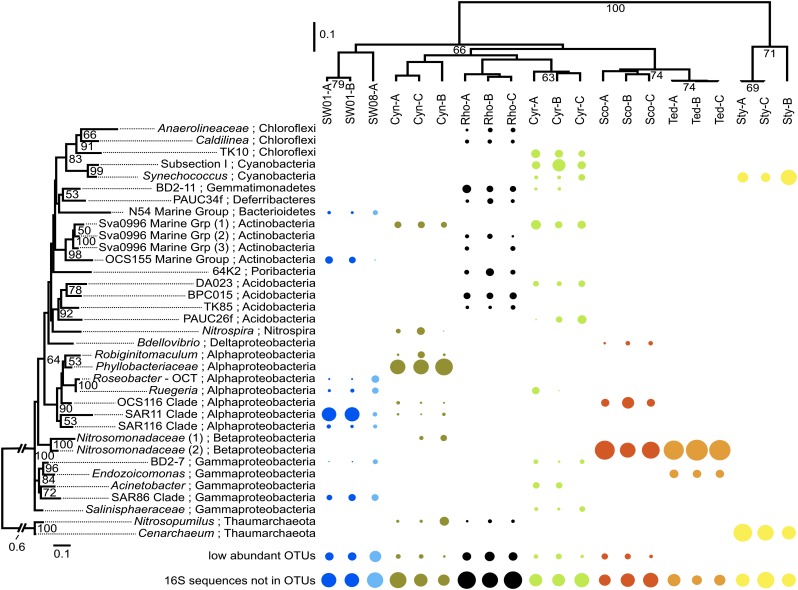
Fig. 2.
Microbial community diversity of sponge and seawater samples. (Right) The relative abundance of the 35 most abundant OTUs (according to the sum of the relative abundance across all samples). Phylogenetic distance cutoff for OTU generation is 0.03. The size of the circle reflects the relative abundance of an OTU in a sample. (Left) Maximum-likelihood tree of the OTUs. Bootstrapping percentages greater than 50% are given (1,000 replications). The tree is rooted with the archaeal clade. Samples are clustered based on the phylogenetic relationships of their OTUs (the top 35 OTUs and the other, low-abundant OTUs) using the weighted Unifrac algorithm with 1,000 rounds of Jackknife values (in percentages) shown in nodes. “16S rRNA sequences not in OTUs” indicates reads that fail to assemble into contigs used for OTU generation.

