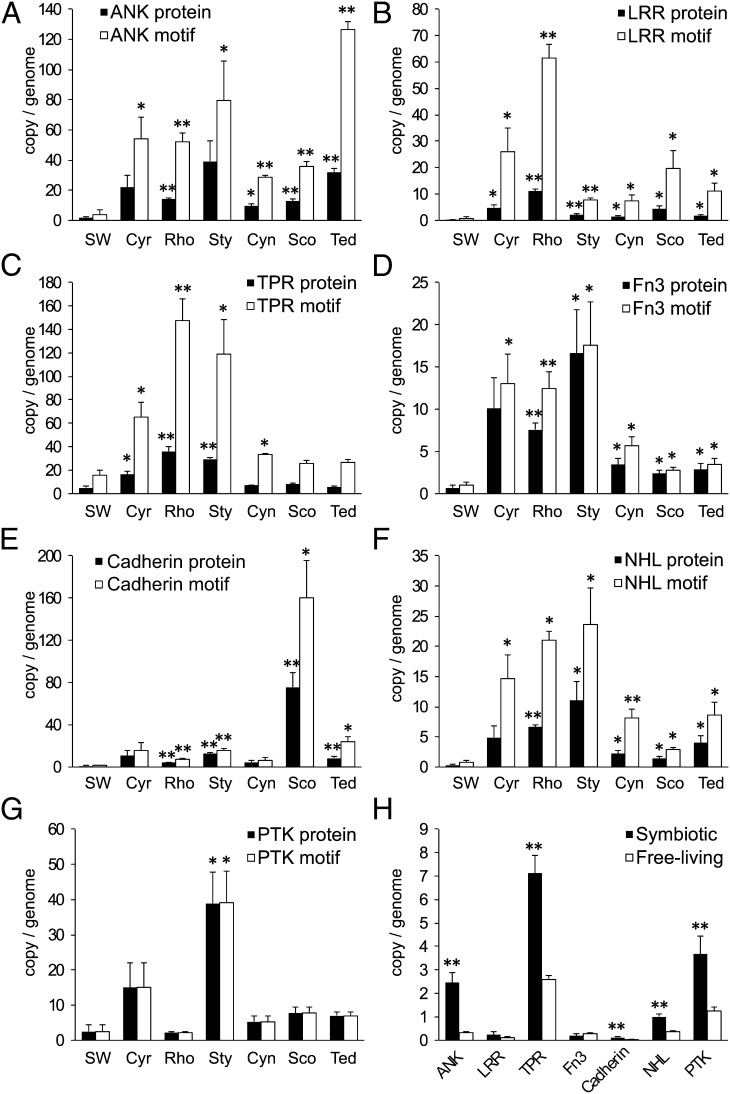
Fig. 6.
Abundance of ELPs in seawater versus sponge samples (A–G) and in free-living versus symbiotic species in the Integrated Microbial Genomes database (accessed November 25, 2011) (H). Abundance is normalized by copies per genome of each sample. “Abundance of motifs” refers to the number of repeats; “abundance of proteins” refers to the number of proteins with the repeat; the ratio of abundance of motifs to abundance of repeats gives an estimate of the average number of motifs per protein. Error bars show SDs. Tests between each sponge and the seawater group were performed at 95% confidence interval, and significant differences are marked. *P ≤ 0.05 but > 0.01; **P ≤ 0.01.

