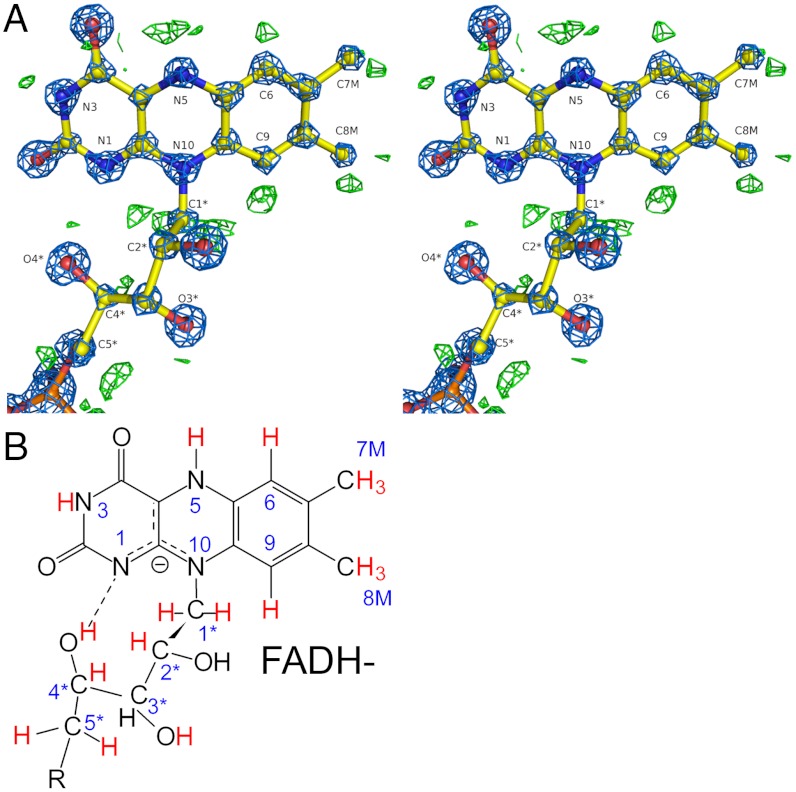
Fig. 5.
Complete assignment of the protonation state of two-electron reduced FAD in POX. (A) Stereo view of the final refined model, the corresponding 2Fo-Fc electron density map (blue, contour level 5σ), and the σA-weighted Fo-Fc difference electron density map (green, contour level 3σ, carved 1.5 Å around FAD). Positive peaks in the difference density map are only observed for expected hydrogen “riding positions.” Detected and assigned hydrogens are highlighted in red color in (B). Note that the electron density maps suggest accumulation of FADH- rather than FADH2.

