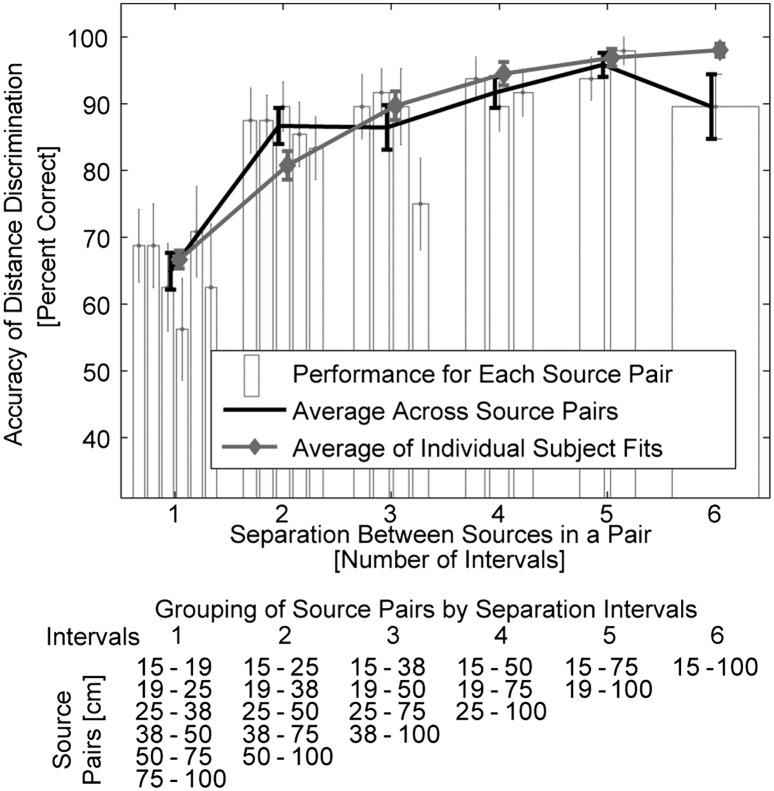
Fig. 2.
Behavioral distance discrimination responses. The black line shows across-subject average accuracy collapsed across simulated source pairs separated by the same number of unit log-distance intervals (Fig. 1A and table Below). The accuracy improved as the simulated source separation (number of intervals) increased, reflecting the robustness of our virtual 3D stimuli. Gray line represents the averages of individual-subjects’ accuracy predictions on the basis of subjects’ individual estimates of distance sensitivity (d′) (SI Results). Bars show across-subject average performance separately for each source-distance pair. Bars are grouped on the basis of the number of intervals between sources within the pair (table Below lists in each column the source pairs that are separated by the same number intervals; separation ranges from 1 interval (all possible pairs of adjacent sources) to 6 intervals (the closest vs. farthest source). In each group, bars are ordered from left to right on the basis of absolute distances (listed from top to bottom in the table, respectively). No systematic upward or downward trend is visible in performance across source pairs within each group, showing that Weber’s law holds for intensity-independent near-head sound source distances. Error bars represent SEM.

