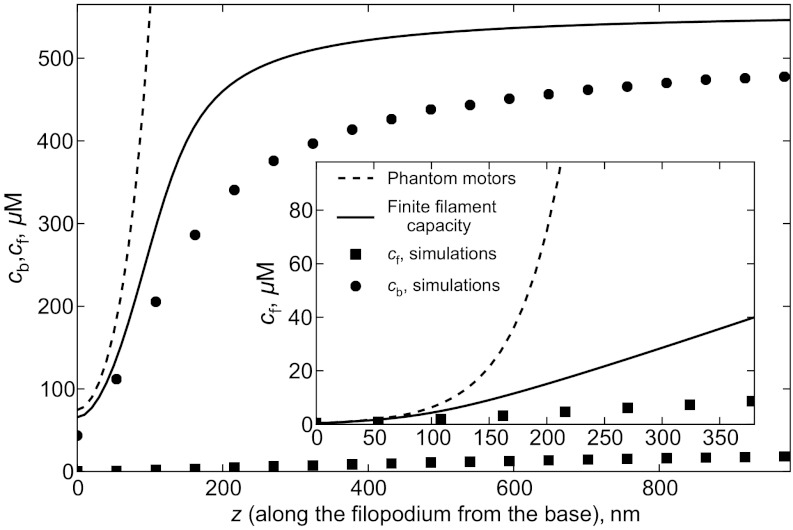
Fig. 2.
Comparison of the mean-field analytical models with the stochastic simulation results. The dashed line is the phantom motors model, the solid line is the FFC model, where limited number of binding sites on the filaments is taken into account. Circles are simulation results for cb, and squares for cf. Inset zooms into low concentration region to show curves for cf.

