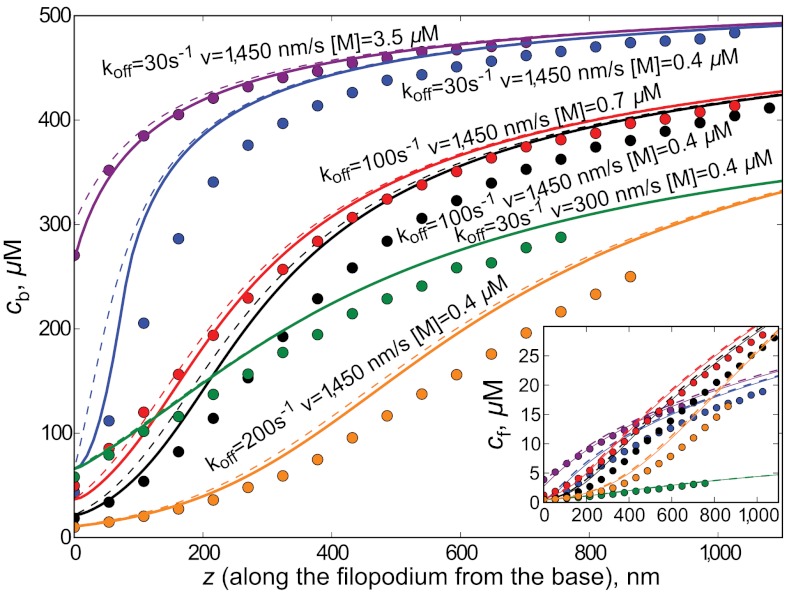
Fig. 3.
Motor concentration profiles inside a filopodium are shown according to stochastic simulations and jammed motors model for various parameter sets (motor affinity to filaments, motor speed, motor concentration). For each set of parameters, the simulations points continue up to the filopodial length from the corresponding simulation. Theoretical curves were computed for all lengths. Inset zooms into low concentration region to show curves for cf. Circles correspond to simulations, solid lines to the numerical solution of the mean-field theory, and dashed lines to analytical solution of the mean-field theory using the approximation of weakly violated detailed balance.

