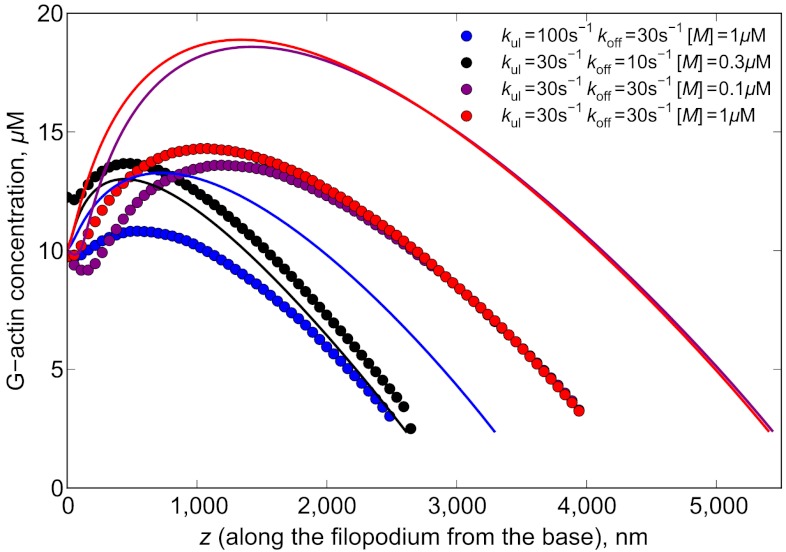
Fig. 4.
G-actin concentration profiles for different parameter values are shown. Circles represent the results of stochastic simulations and lines are the solutions of Eq. 6 for a(z). All the profiles end when the concentration drops below atip (Eq. 5), which is about 2.3 μM for our parameter values.

