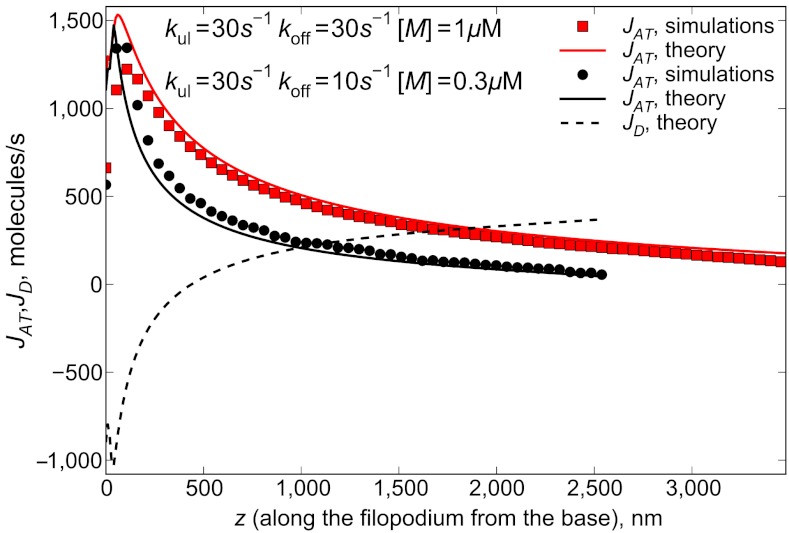
Fig. 5.
Active transport fluxes for different parameter values are calculated as JAT(z) = (v[1 - cb(z)/cs] - vr)A(z). Symbols correspond to A(z) and cb(z) taken from the results of stochastic simulations, and lines are plotted by taking cb(z) and A(z) from the solutions of Eqs. 2 and 6. Active transport flux decreases after the traffic jam is formed. The retrograde flow flux Jr of 415 molecules per second determines the flux of G-actin monomers, which need to be delivered to the tip at steady state. Dashed line shows the diffusional forward flux of G actin for kul = 30 s-1, koff = 10 s-1, [M] = 0.3 μM (corresponding to the black curve on Fig. 4). Active flux is still significant even far from the start of the jam, however, starts to vanish near the tip.

