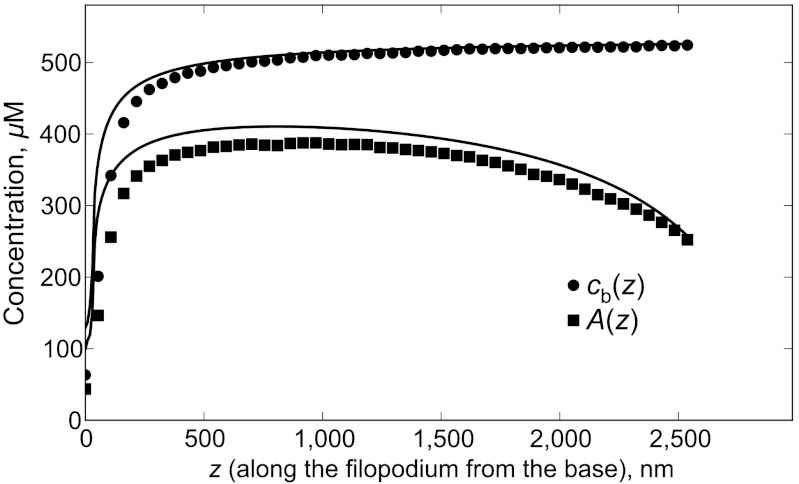
Fig. 6.
Concentration profiles for actin-on-the-motors A(z) and motors cb(z) are shown for kul = 30 s-1, koff = 10 s-1, [M] = 0.3 μM (corresponding to the black curve on Fig. 4) from analytical solution. The concentration of F-actin binding sites cs = N/Sδ = 558 μM caps cb(z), while A(z) is in turn capped by cb(z). Symbols correspond to A(z) and cb(z) taken from the results of stochastic simulations, and lines are plotted by taking cb(z) and A(z) from the solutions of Eqs. 2 and 6.

