Fig. 3.
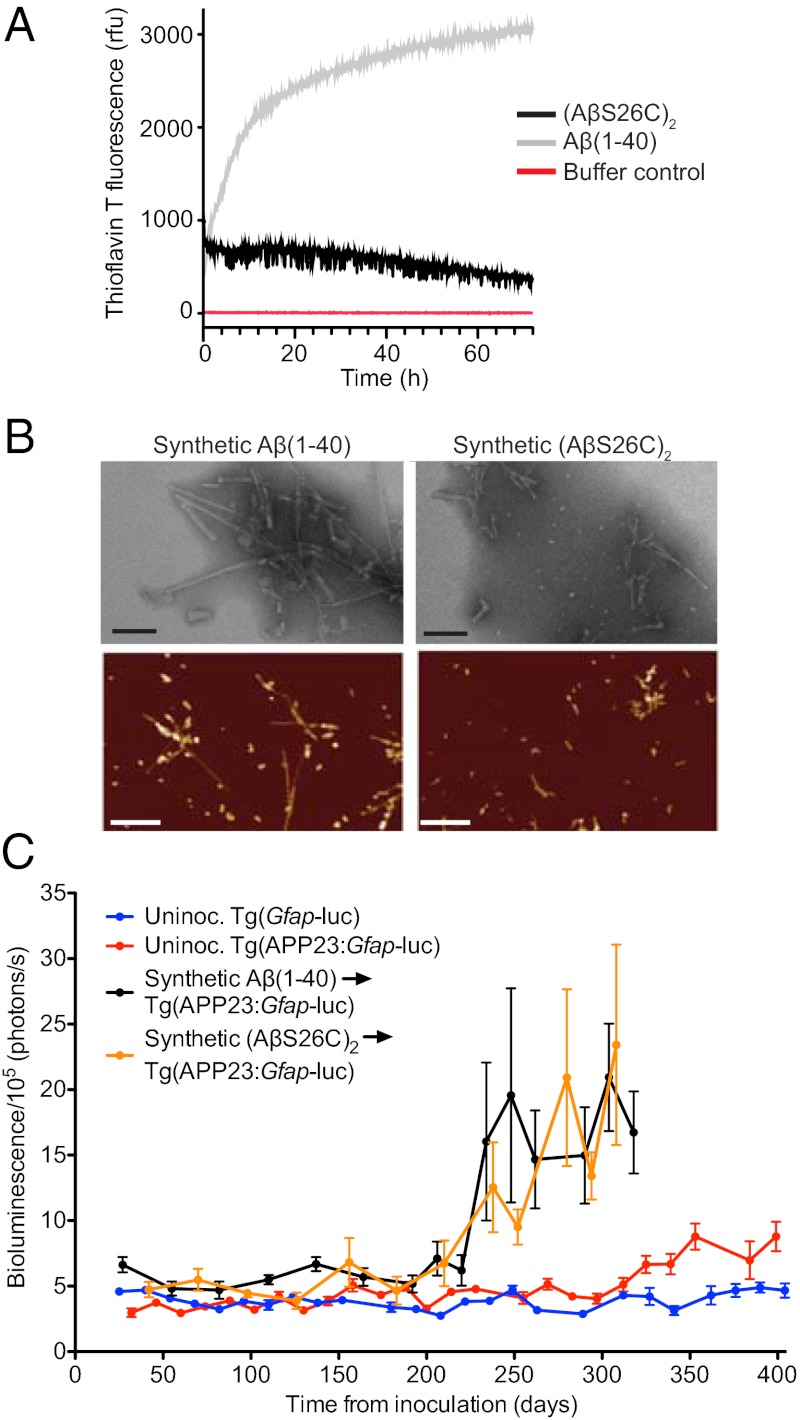
Formation and characterization of synthetic Aβ prions. (A) Time course of thioflavin T measurements of Aβ(1–40) (gray line) and (AβS26C)2 (black line) following solubilization, compared with buffer control (red line). (B) Electron microscopy (Upper) (Scale bars, 100 nm.) and atomic force microscopy images (Lower) (Scale bars, 500 nm) of fibrillar aggregates from Aβ(1–40) and (AβS26C)2. (C) Mean brain bioluminescence (± SEM) signals obtained from uninoculated Tg(Gfap-luc) mice (blue, n = 16), uninoculated Tg(APP23:Gfap-luc) mice (red, n = 12), and Tg(APP23:Gfap-luc) mice inoculated with synthetic Aβ aggregates composed of either WT Aβ(1–40) peptide (black, n = 6) or (AβS26C)2 peptide (orange, n = 8). An increase in the BLI signal was observed in mice inoculated with the synthetic Aβ aggregates by ∼230 dpi.

