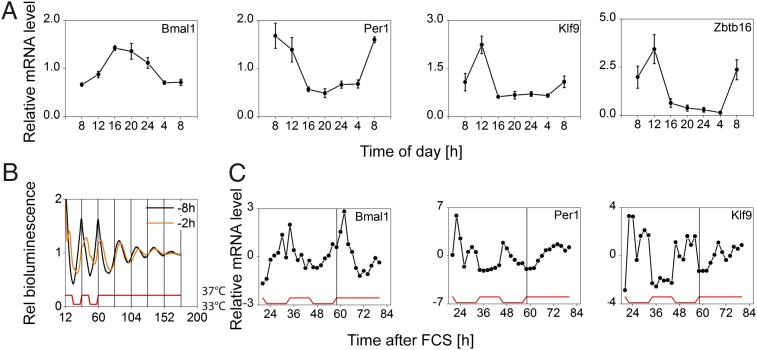
Fig. 2.
Epidermis clock in vivo and in vitro. (A) Gene expression in punch-biopsy epidermis obtained at indicated times is shown relative to 24-h mean expression (mean of six subjects ± SEM; except Zbtb16: n = 5). Bmal1, Per1, Zbtb16: P < 0.001; Klf9: P = 0.001. (B) Circadian rhythms of Bmal1 reporter activity in primary keratinocytes. Note that instant entrainment is achieved if FCS is administered 8 h before the temperature cycles (black curve). This synchronization paradigm was used for subsequent experiments. (C) Cells were harvested in regular 2-h intervals starting 24 h after FCS for 60 h and mRNA levels of depicted genes were determined. Expression levels are given relative to mean expression. Bmal1, Per1: P < 0.001; Klf9: P = 0.001. (For P values during entrainment and free run, see Table S1C). Statistical analysis for circadian gene expression was performed using CircWave software (43).

