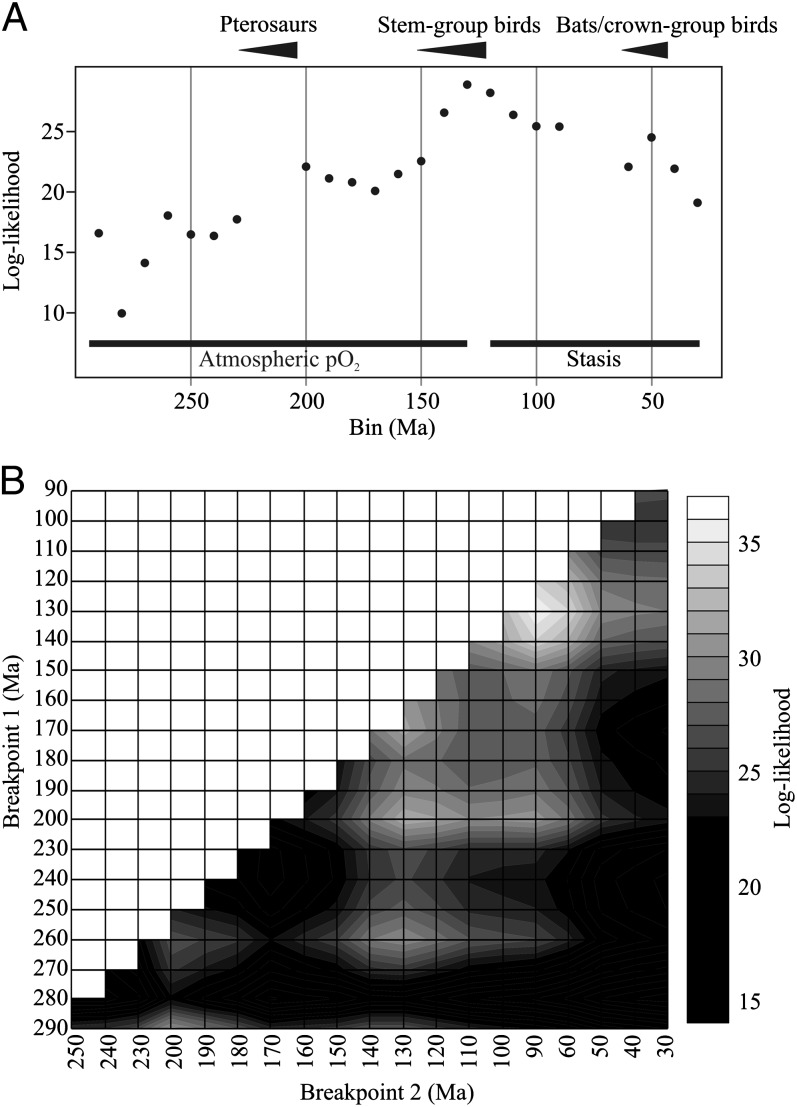
Fig. 2.
Maximum-likelihood model fit relative to timing of shift from atmospheric pO2 control to size stasis. (A) Log-likelihood plotted against all possible breakpoints in a two-phase size evolution model. Greater log-likelihoods indicate greater support for a breakpoint, implying that the best breakpoint is at 140–130 Ma. (B) Log-likelihood contours on all possible two-breakpoint combinations in a three-phase size evolution model (breakpoints must be separated by three intervals to fit the models). The best-supported pair of breakpoints is at 140–130 Ma and 90–60 Ma. The support for a 270–260 Ma breakpoint is an artifact of the shift from extremely insect-rich bins to insect-poor Late Permian bins.

