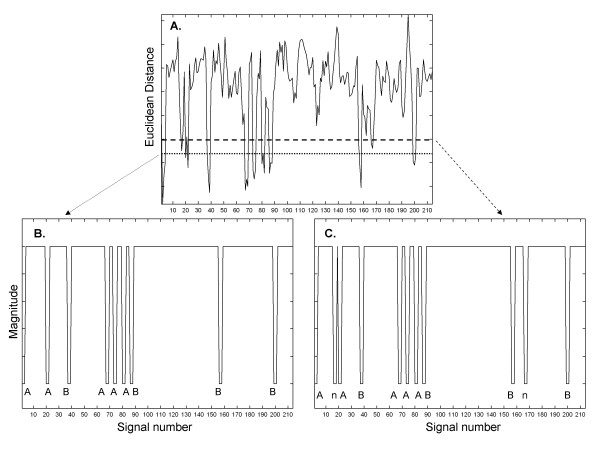
Figure 5.
The Euclidean distance between the power spectrum of the mean from 216 recordings, and the spectral signatures of 214 individual recordings with interference added (panel (A)). Two thresholds are shown (horizontal lines) which produce different binary functions for recognition (panels (B) and (C)).

