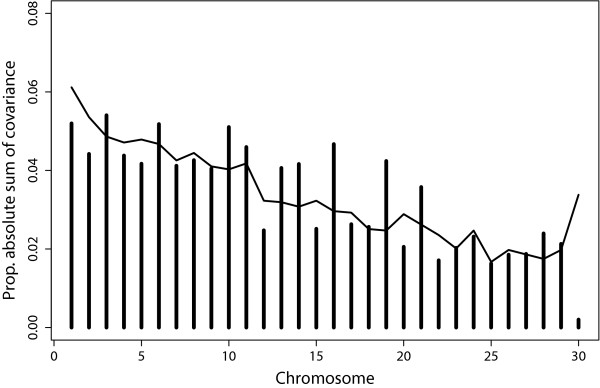
Figure 4.
Chromosome-wise genomic proportions of the sum of covariancea between Staph. aureus and E. coli. Bars reaching above the line indicate that a chromosome explains more genomic covariance than expected based on its size; anegative covariances were not observed; covariances as bars and relative genome size as line.

