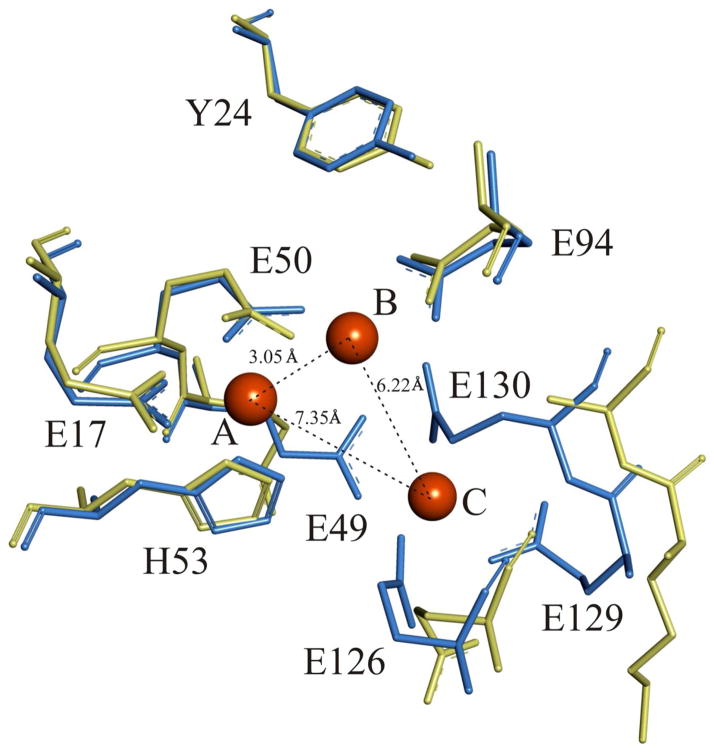
Figure 2.
X-ray crystallographic structural comparison of the trinuclear iron binding center of PfFtnA (blue)12 and the binuclear ferroxidase site of HuHf (yellow).7 The residues are labeled according to the sequence number of EcFtnA (see Figure 1). The orange balls indicate the three bound Fe atoms, which are labeled as A, B and C in accord with Stillman et al.9 Fe – Fe distances are as indicated.

