
Figure 3.
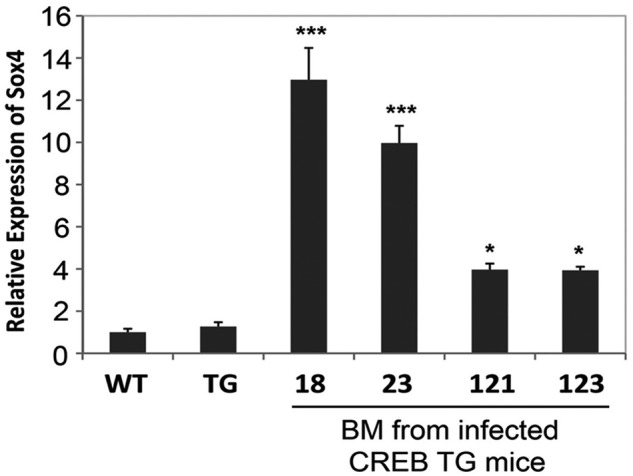
MOL4070LTR proviral integration. Real-time PCR analysis of Sox4 expression in the bone marrow of 4 representative CREB TG mice with leukemia. WT and TG control samples on graph represent Sox4 expression in bone marrow from normal WT and TG mice (ANOVA test P < .0001, Tukey *P < .05, **P < .01 ***P < .001). Real-time PCR experiments were performed in triplicate.