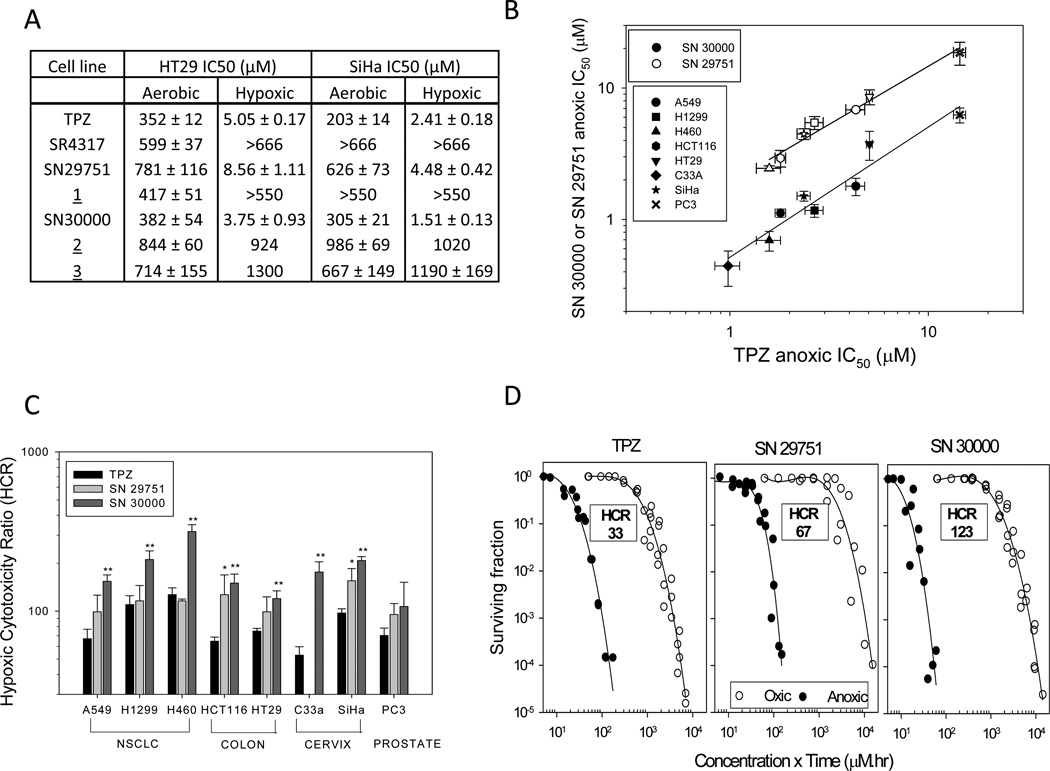
Figure 2.
Hypoxia-selective cytotoxicity of TPZ, SN29751 and SN30000 in human tumor cell cultures. Values are means and SEM for 2–10 experiments. A, IC50 for HT29 and SiHa cells following 4 h drug exposure under aerobic or hypoxic conditions. B, hypoxic IC50 in 8 human tumor cell lines. Lines are linear regressions. C, hypoxic cytotoxicity ratios (HCR, aerobic IC50/hypoxic IC50) in the same cell lines. Differences from TPZ by ANOVA: *, p<0.05; **, p<0.01. D, clonogenic survival of HT29 cells as a function of exposure under hypoxia (0% O2) and oxic conditions (20% O2).

