Fig. 2.
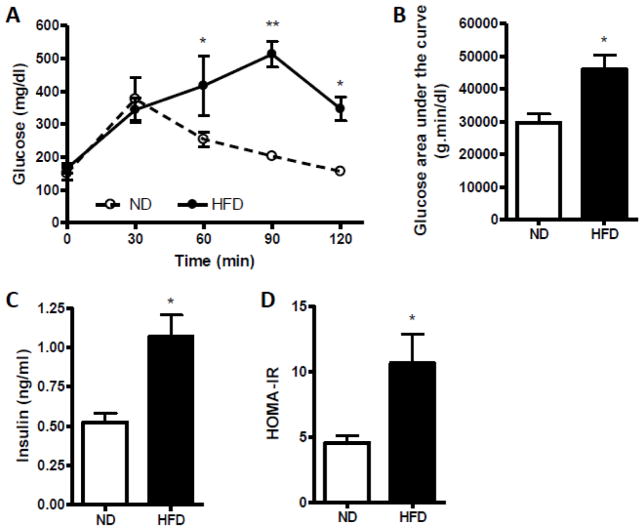
Glucose homeostasis in C57BL/6 mice fed a normal diet (ND) or high-fat diet (HFD). A, Effect of HFD on glucose tolerance by intraperitoneal glucose tolerance test (IPGTT). B, Glucose area under the curve calculated from the glucose tolerance test in part A. C, Effect of HFD on fasting plasma insulin level. D, The homeostasis model assessment insulin resistance (HOMA-IR) index. n=4 per group. *p < 0.05, **p < 0.01 compared with the ND group.

