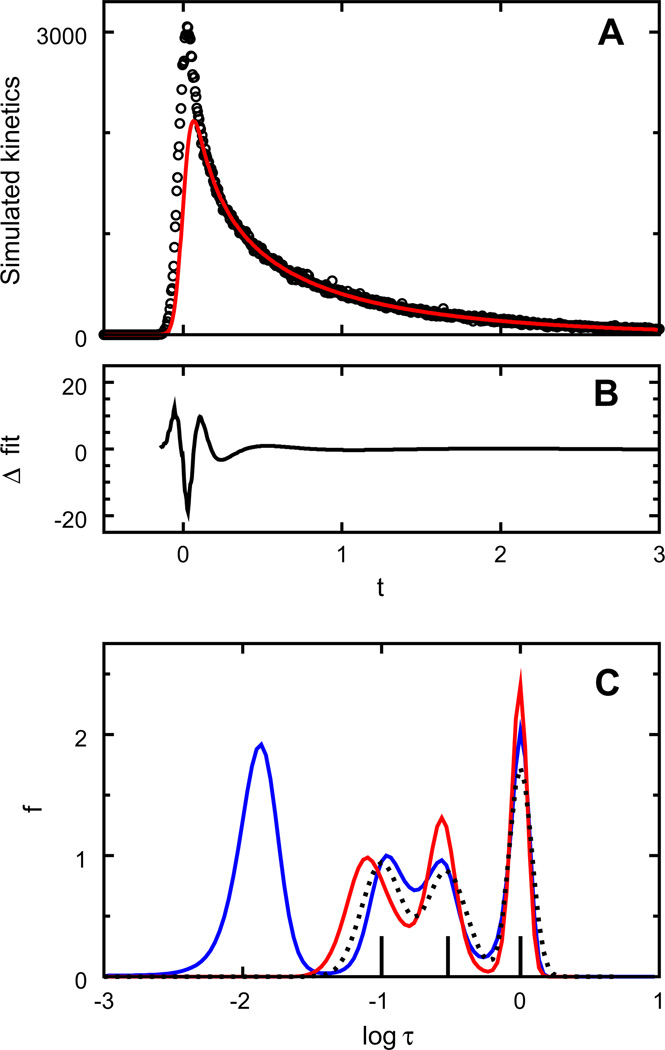
Fig. 2.
MemExp analysis of kinetics simulated as a sum of three exponentials convolved with a Gaussian instrument response. (A) Simulated data with (circles) and without (red line) scattered light and Poisson noise added. (B) Difference in the two fits to the noisy data obtained at a Poisson deviance of 1.041. (C) Corresponding lifetime distributions recovered using a uniform prior model (blue) and using a model bootstrapped from the data by omitting features resolved with the uniform model peaked at log τ < −1.2 (red). Also shown are the bootstrapped model (dotted line) and the “true” exponentials (vertical bars).

