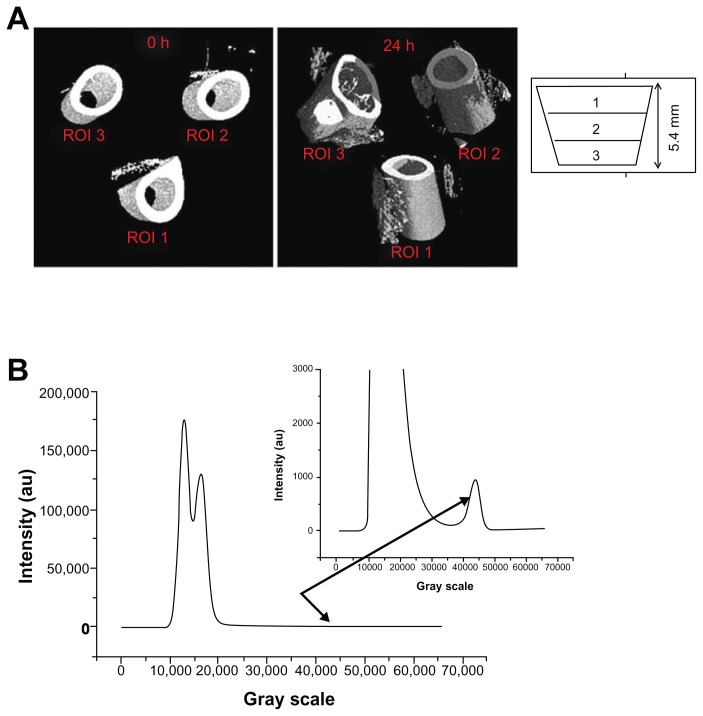
Figure 1.
Micro-CT procedure. (A) Tomograms of the tight region at 0, 2, 13, and 24 hours after injection; the femur zone has been subtracted to calculate the volume fraction of the Endorem-marked cells. Some marked cells are necessarily cut out in this way, but their amount is negligible with respect to the total amount present in the region of interest. (B) Histogram and detail for the investigated mouse, injected with 500,000 cells.
Abbreviation: CT, computed tomography.

