
FIGURE 5.
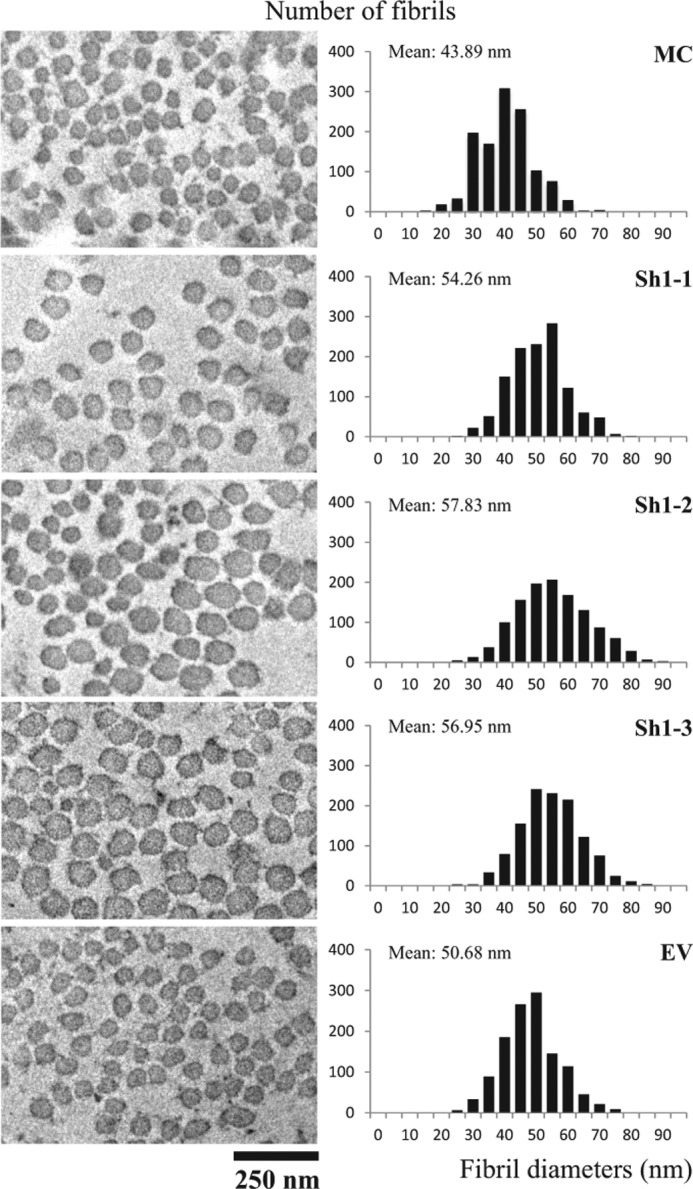
Ultrastructural analysis of collagen fibrils in cell cultures. The cells/matrices were collected from MC, EV, and Sh clones after 2 weeks of culture, and the cross-section of the collagen fibrils was observed under a transmission electron microscope. The images were taken at a magnification of ×25,000 using Gatan's Digital Micrograph software. Fibril diameters were measured using ImageJ 1.44p software, and the diameter distribution was plotted based on the total number of 1200 fibrils per clone and is shown on the right.