FIGURE 3.
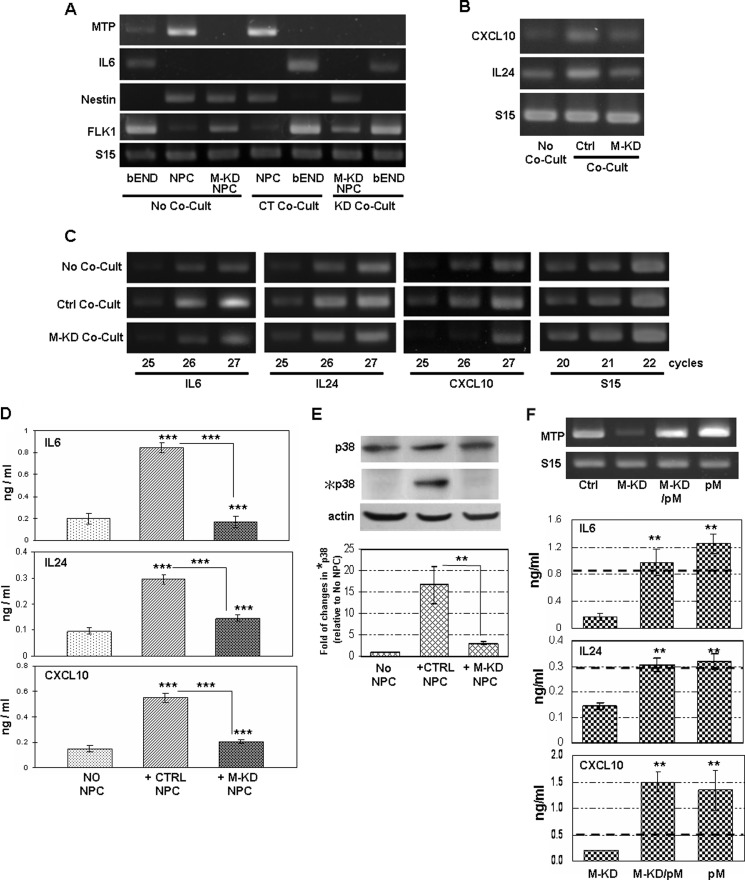
Endogenous expression of MTP in NS/P cells mediates cell-contact induced endothelial p38 MAPK activation and cytokine/chemokine expression. A, RT-PCR assay of MTP and IL6 mRNAs in NS/P cells (NPC), bEND cells (bEND), and MTP knockdown NS/P cells (M-KD NPC) without co-culture (No Co-Cult). MTP and IL6 mRNAs in bEND cells in contact with NS/P cells transfected with control siRNA (CT Co-Cult) or with MTP siRNA (KD Co-Cult) were compared. Endothelial FLK1 and NPC marker nestin are used as monitors for bEND cells and their purity after co-culture. B, expression of CXCL10 or IL24 in bEND cells cultured without NS/P cells (No Co-Cult), after direct contact co-culture (Co-Cult) with control siRNA transfected (Ctrl) or with MTP siRNA transfected (M-KD) NS/P cells. C, semiquantitative PCR for IL6, IL24, and CXCL10 in bEND cells cultured without NS/P cells (No Co-Cult), after direct contact co-culture with control siRNA transfected NS/P cells (Ctrl Co-Cult) or with MTP siRNA transfected NS/P cells (M-KD Co-Cult). PCR product after 25, 26, and 27 cycles of amplification were shown. The PCR product of internal control S15 was taken after 20, 21, and 22 cycles of amplification. A–C show the representative data of at least three independent experiments. S15 is loading control for RT-PCR. D, ELISA of IL6, IL24, and CXCL10 proteins in conditioned medium of bEND cells cultured without NS/P cells (No NPC), bEND cells after contact with control siRNA transfected (+Ctrl NPC), or with MTP knockdown (+M-KD NPC) NS/P cells. Asterisks above the bars indicate significant difference compared with No NPC. Comparisons were also made between +CTRL NPC and +M-KD NPC. E, total and phosphorylated p38 MAPK protein (p38 and *p38, respectively) in bEND cells cultured in conditions described in D. Actin is the endogenous loading control for Western blot. The graph shows quantitation of chemiluminescence by densitometry. The value of phosphorylated p38 was normalized to that of the total p38 for each sample; the resulting value was then normalized to that of bEND cells without co-culture that is set at 1. Comparisons were made between +CTRL NPC and +M-KD NPC. F, image on the left shows RT-PCR of MTP in NS/P cells (Ctrl), in MTP knockdown NS/P cells (M-KD), and in MTP knockdown or control NS/P cells transfected with MTP expression vector (M-KD/pM and pM, respectively). The graphs on the right show ELISA of IL6, IL24, and CXCL10 proteins in conditioned medium of bEND cells cultured with MTP knockdown (M-KD) cells and with MTP knockdown or control NS/P cells carrying MTP expression vector (M-KD/pM and pM, respectively). The dark dotted line across each graph shows the amount of each molecule induced by the control NS/P cells. Cultures with M-KD/pM or pM were compared with cultures with M-KD. **, p ≦ 0.01.

