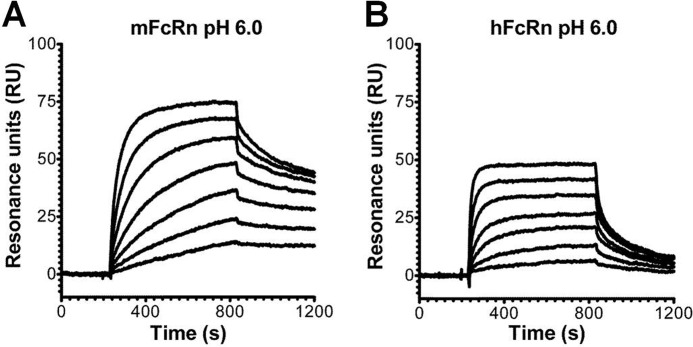
FIGURE 4.
SPR analyses of the interaction of chimeric anti-CEA T84.66 IgG1 with mFcRn and hFcRn. Representative sensorgrams show serial dilutions of anti-CEA T84.66 IgG1(0.004–1 μm) injected over a flow cell coupled with mFcRn (∼300 RU) (A) and hFcRn (∼400 RU) at a flow rate of 50 μl/min (pH 6.0) (B). The sensorgrams were zero-adjusted and reference cell data subtracted.

