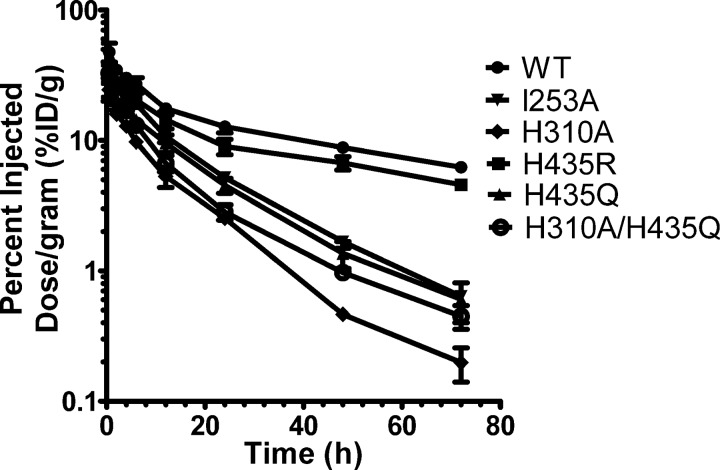
FIGURE 7.
Blood activity curves of 123I-labeled scFv-Fc fragments in hFcRn transgenic mice. Mice were injected with 96–130 μCi of 123I-labeled scFv-Fc proteins (30 μg of labeled protein/mouse) under anesthesia. Blood samples were collected from the tail immediately after injection (0-h time point) and at time points 2, 4, 6, 12, 24, 48, and 72 h post-injection. Blood activity was determined using a Wallac WIZARD automatic gamma. The percentage of injected dose/g (% ID/g) was calculated. Each group represents four mice. Logarithmic scale, S.E. was used to measure variability.

