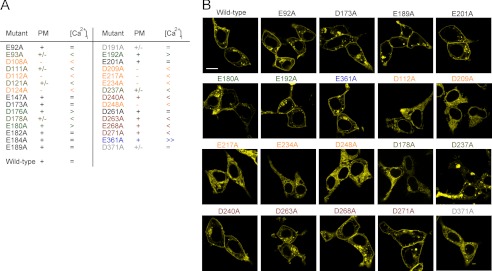
FIGURE 2.
Subcellular localization of TRPML3 loop mutants. A, the table summarizes the laser scanning microscopy and calcium imaging results. PM, plasma membrane localization; +, plasma membrane localization comparable with the wild type; +/−, mostly intracellular localization with some potential distribution in the plasma membrane; −, obvious intracellular localization of the channel protein; =, unchanged basal calcium levels compared with the wild-type control; <, >, and ≫, decreased, increased, and strongly increased basal calcium levels in HEK293 cells transfected with the respective mutant isoforms. B, subcellular localization of YFP-tagged wild-type TRPML3 and selected mutant isoforms overexpressed in HEK293 cells and analyzed by laser scanning microscopy. Scale bar = 10 μm.

