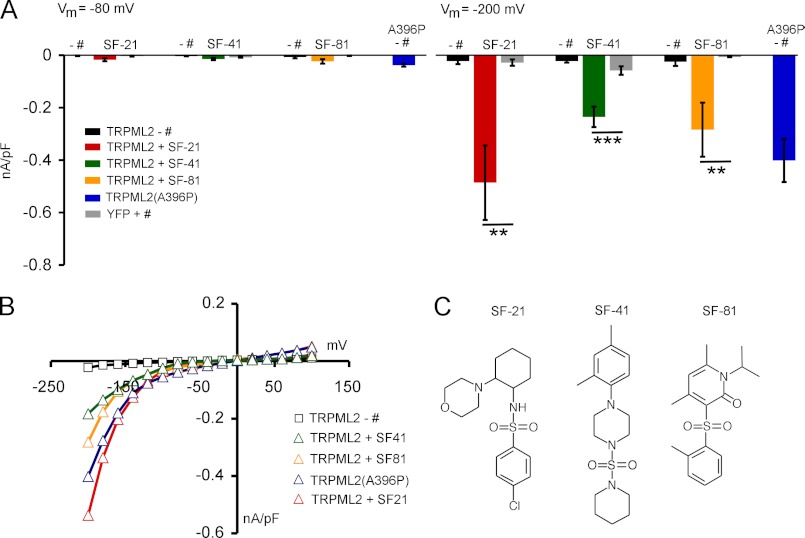
FIGURE 5.
Effect of different chemical stimuli on TRPML2. A, average inward current densities in the presence and absence of different chemical stimuli in SBS from experiments as shown in B at −80 and −200 mV and normalized by cell capacitance (picofarads (pF)). Shown are means ± S.E. ***, p < 0.0001; **, p < 0.001 (unpaired Student's t test). + #, with compound; − #, without compound. Compounds were used at a final concentration of 10 μm each. B, steady-state current-voltage plots of whole-cell currents as summarized for A in the presence of different chemical stimuli in SBS. The major cation in the pipette solution was 150 mm Cs+ (pH 7.2). C, chemical formulae of compounds SF-21, SF-41, and SF-81.

