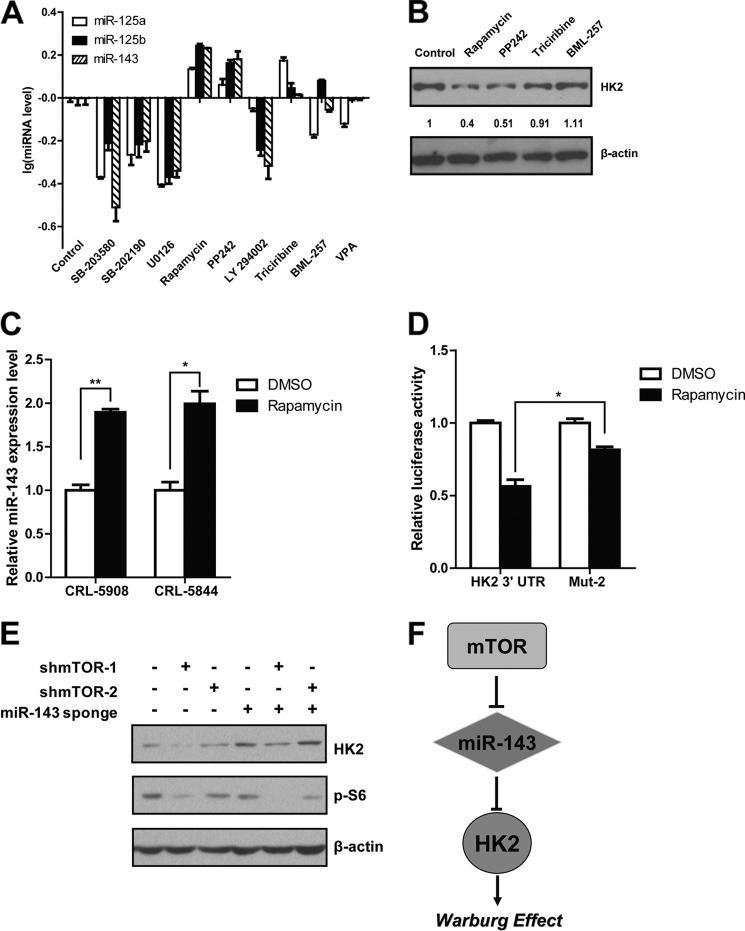
FIGURE 5.
The mTOR signaling pathway participates in miR-143 regulation. A, detection of miRNA expression in CRL-5807 cells after treatment with different pathway-specific inhibitors: SB-203580 and SB-202190, p38 MAPK inhibitors; U0126, MEK inhibitor; rapamycin and PP242, mTOR inhibitors; LY-294002, PI3K inhibitor; triciribine and BML-257, Akt inhibitors; valproic acid (VPA), histone deacetylase inhibitors. B, Western blot analysis of HK2 after treatment with mTOR or Akt inhibitors. C, detection of miR-143 expression in CRL-5908 and CRL-5844 cells after treatment with rapamycin. D, reporter gene assay with the reporter plasmids carrying either wild-type or mutated HK2 3′-UTR with or without rapamycin treatment in CRL-5908 cells. *, p < 0.05 and **, p < 0.01. DMSO, dimethyl sulfoxide. E, measurement of HK2 and phospho-S6 expression with or without miR-143 sponge expressed in CRL-5803 cells after mTOR knockdown. F, a schematic diagram shows linking mTOR signaling to the miRNAs that participate in the Warburg effect in cancer via regulating HK2.

