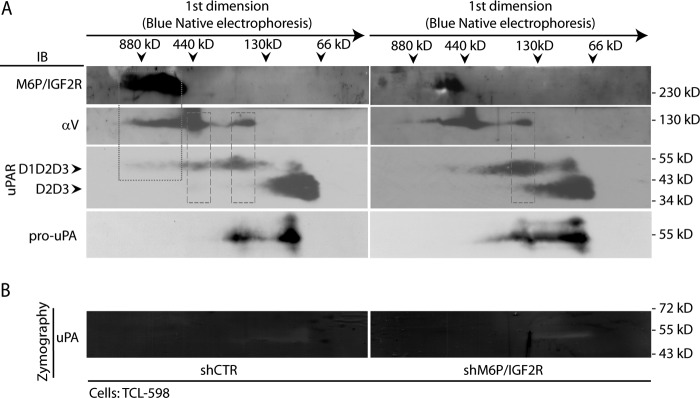
FIGURE 2.
BN/SDS-PAGE analysis of the effect of M6P-IGF2R silencing on reorganization of membrane protein complexes associated with Plg activation. A, cell membrane fractions derived from control (shCTR)- and M6P-IGF2R-silenced (shM6P-IGF2R) TCL-598 cells were prepared by solubilization with Triton X-100 as described under “Experimental Procedures.” The samples were then analyzed by BN-PAGE in the first dimension followed by SDS-PAGE in the second dimension. For the immunoblotting analysis (IB), the mAbs to M6P-IGF2R (mAb MEM-238), αV integrin (mAb P3G8), uPAR (mAb H2), and pro-uPA (mAb scuPA8) were used followed by an HRP-conjugated anti-mouse Ab and chemiluminescence detection. D1D2D3 points to the band corresponding to the full-length uPAR, and D2D3 points to the band corresponding to the truncated form. Molecular mass markers are shown on the top for the first dimension (dimers and monomers of Ferritin (880, 440 kDa) and BSA (130, 66 kDa)) and along the panel border for the second dimension (standard SDS-PAGE molecular mass markers). The dotted frame indicates the complex of M6P-IGF2R, αV integrin, and uPAR (D1D2D3) in shCTR cells. The dashed frame indicates the complex of αV integrin and uPAR. B, the gel strips from the first dimension of BN/SDS-PAGE were analyzed by zymographic SDS-PAGE as described under “Experimental Procedures.” Afterward, the gel was scanned, and the images were analyzed. The images are presented in a grayscale mode so that the clear zones represent the areas of proteolytic activation. Standard molecular masses are shown along the panel border. Results are representative for two independent experiments.

