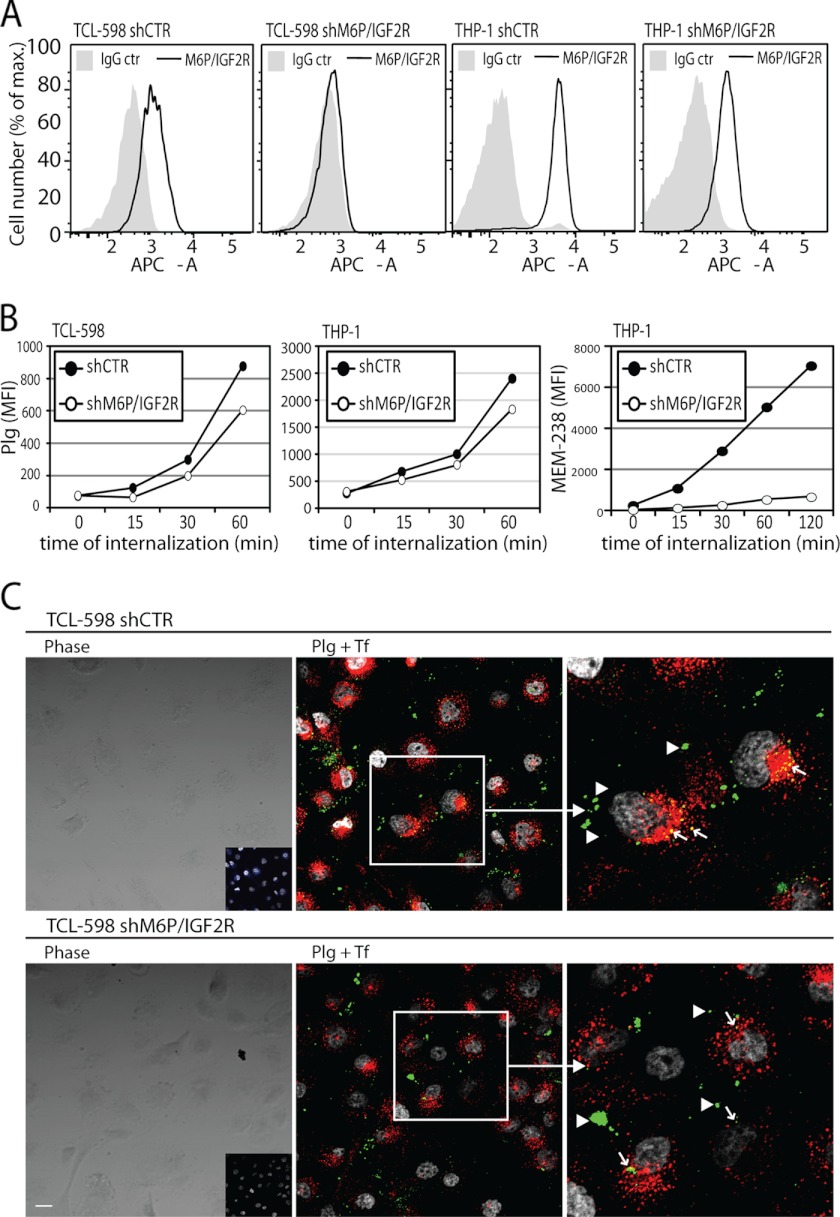
FIGURE 6.
Effect of M6P-IGF2R silencing on Plg internalization in human cell lines. A, shown is expression of M6P-IGF2R on the surface of M6P-IGF2R-silenced (shM6P-IGF2R) versus control-silenced (shCTR) TCL-598 and THP-1 cells. mAb MEM-238 conjugated to APC was used as a specific mAb. B, precooled control-silenced and M6P-IGF2R-silenced TCL-598 and THP-1 cells were subjected to the internalization assay with Plg conjugated to AF488 (100 nmol/liter) and the anti-M6P-IGF2R MEM-238-APC (5 μg/ml). C, confocal microscopy was used to investigate Plg uptake in TCL-598 cells silenced for M6P-IGF2R (shM6P-IGF2R) and in control silenced cells (shCTR). The cells were incubated for 20 min at 37 °C with labeled Plg (Plg-AF488), transferrin (Tf-AF546), and the mAb MEM-238-AF647. Subsequently, medium was discarded, the cells were rinsed, fixed, and permeabilized, and nuclei were visualized with DAPI. The left panels show the phase contrast images with the inset panels showing the confocal fluorescent images of the anti-M6P-IGF2R mAb MEM-238-AF647 (blue). The middle panels show the merged confocal fluorescent images of Plg-AF488 (green) and transferrin-AF546 (red); colocalization areas appear yellow (arrows); the arrowheads point to Plg aggregates on the cell surface. The right panels show the magnified insets from the middle panels. DAPI is shown in gray. Scale bars = 20 μm.

