
FIGURE 1.
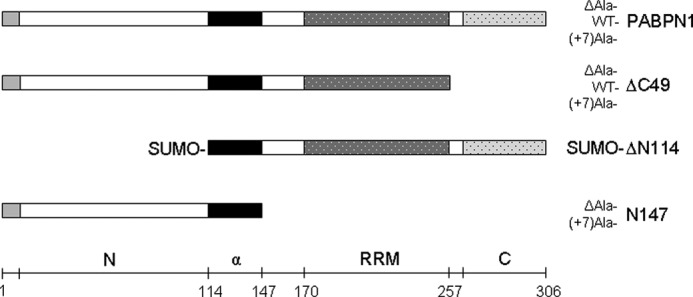
Schematic representation of PABPN1 and deletion variants. Light gray part shows the alanine segment, the following open bar depicts the N-terminal domain. The black bar indicates the α-helical segment that precedes the RRM domain, the C-terminal segment is shown by the dotted bar. N, N-terminal domain; α, α-helical segment; C, C-terminal domain.