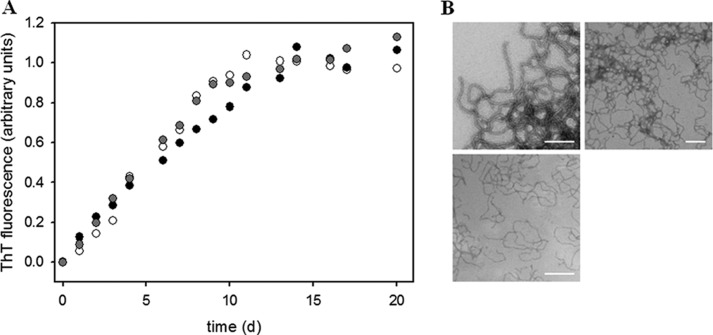
FIGURE 2.
Fibril formation of full-length PABPN1. A, time-dependent ThT fluorescence increases monitored at 482 nm. Black circles, WT-PABPN1; open circles, ΔAla-PABPN1; and gray circles, (+7)Ala-PABPN1. Samples were incubated at 20 °C at a protein concentration of 60 μm. B, electron micrographs of fibrillar WT-PABPN1 (upper left), ΔAla-PABPN1 (upper right), and (+7)Ala-PABPN1 (lower). Scale bars, 200 nm.

