
FIGURE 3.
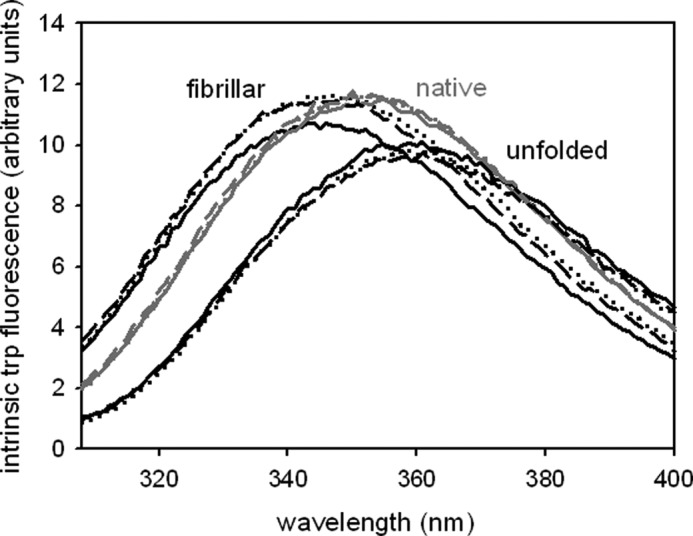
Tryptophan fluorescence analysis. Samples with protein concentrations of 4.5 μm were excited at 295 nm. Emission spectra of native (monomeric), unfolded and fibrillar WT-PABPN1 (solid line), ΔAla-PABPN1 (dotted line), and (+7)Ala-PABPN1 (dashed line) were recorded.