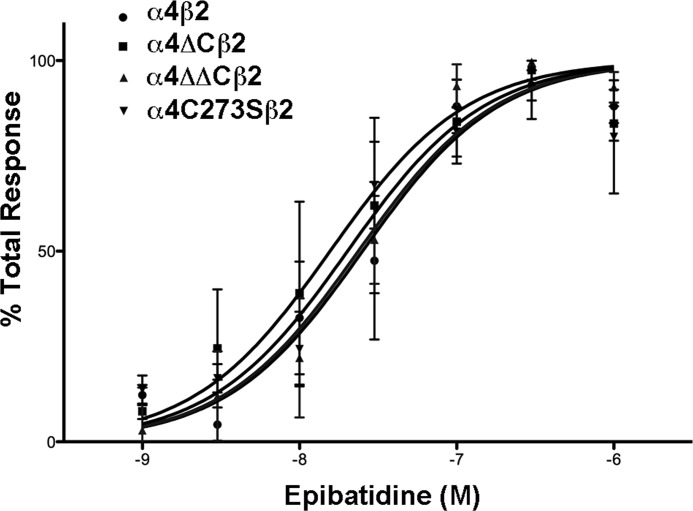
FIGURE 4.
There is no significant change in the EC50 for α4 nAChR cysteine mutants. Cultured tsA 201 cells expressing the various α4 constructs plus β2 were loaded with calcium5 NW dye for 60 min, stimulated with either 1, 3, 10, 30, 100, 300, or 1000 nm epibatidine, and intracellular calcium was measured via fluorescence. Results are expressed as percentage of epibatidine peak fluorescence levels after subtracting basal fluorescence. Values represent means ± S.E., n = 4 for α4 and α4ΔC; n = 3 for α4ΔΔC and α4C273S. The data were fitted to a normalized dose-response curve using the equation Y = 100/(1 + 10((log EC50 − X)·HS), where Y is the percentage of the maximal effect at a given concentration (X), and HS is the Hill slope (Hill slope = 1).

