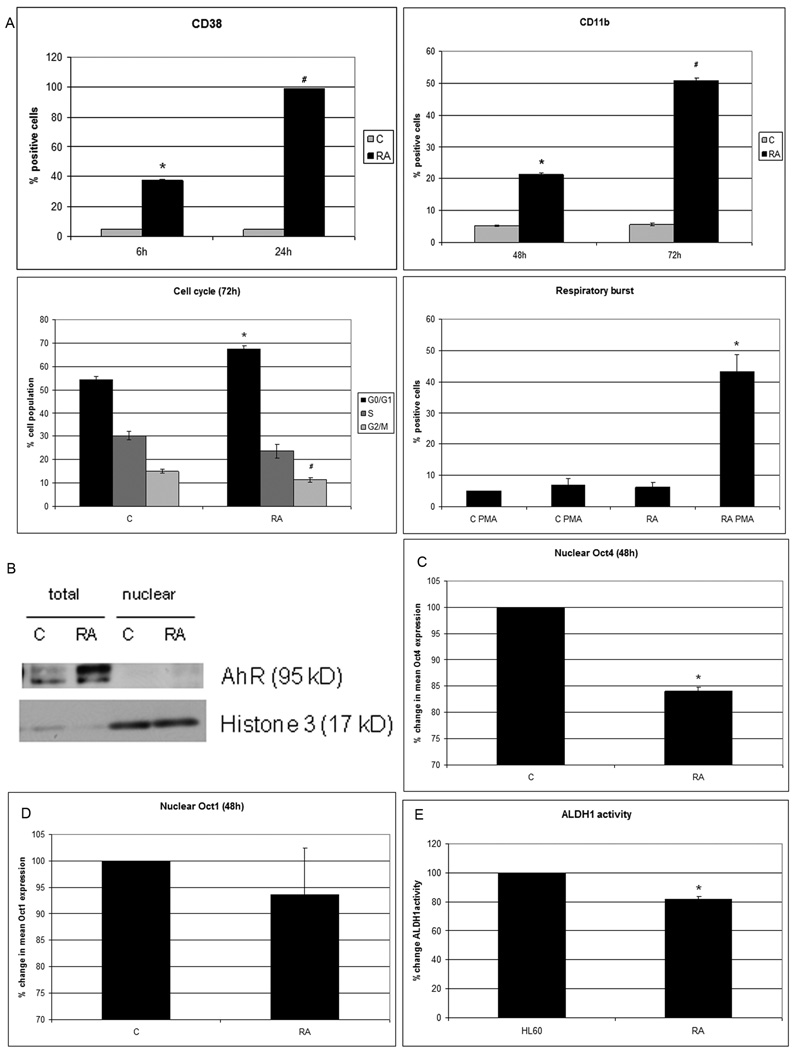
Figure 1. RA induces differentiation, AhR upregulation and Oct4 downregulation.
A.CD38 expression (assessed with PE-conjugated antibody) at 6 and 24h post-treatment is significantly induced by RA (P<0.0005). CD11b expression (assessed with APC-conjugated antibody) at 48 and 72h post-treatment is significantly induced by RA (P<0.0005). Flow cytometric assay of live cells was performed setting the logical gate to exclude 95% of the untreated cells (CD38 and CD11b detection). RA induces a significant (p<0.05) G0 cell cycle arrest compared to control. G2/M accumulation is significantly decreased by RA (p=0.01) as shown by flow cytometry of DNA stained nuclei. Inducible oxidative metabolism is increased by RA (p=0.03) Flow cytometric assay of live cells was performed setting the logical gate to exclude 95% of the untreated cells. B. AhR protein is upregulated and post-transcriptional modified by RA treatment as showed 72h post treatment by Western blot. AhR appear to largely reside in the cytosol. C. Nuclear Oct4 protein of G0 nuclei is significantly decreased (p<0.005, 48h after treatment). D. Nuclear Oct1 protein level is unchanged by RA (as shown at 48h). The results of flow cytometric analysis of paraformaldehyde fixed cells are expressed as mean fluorescence of the entire population (C and D). E. Aldehyde dehydrogenase1 activity is significantly lower (p=0.01) in the cells treated with RA compared to control cells, The results of flow cytometric analysis of live cells are expressed as mode fluorescence of the entire population.

